Server alert
Home > Select Project > Alert > Event Configuration
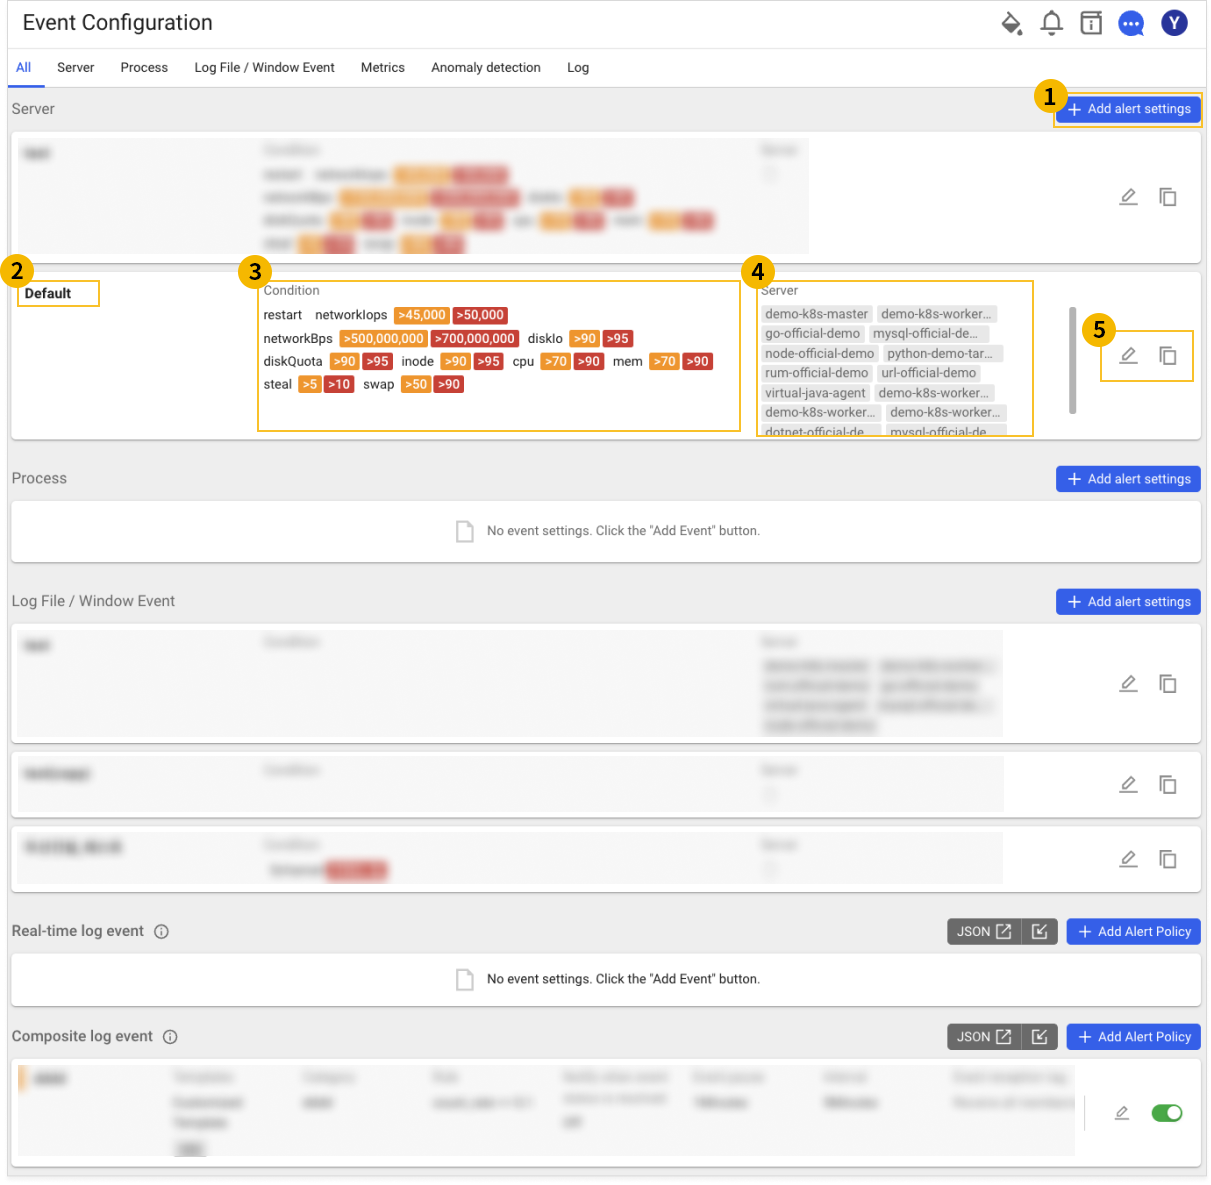
You can create, modify, and delete event policies such as Server, Process, and Log File / Window Event. By selecting an event type, you can configure events according to the server restart, agent's communication failure duration, and resource usage.
-
 + Add alert settings
You can add the event.
-
 Name
NameDisplays the event name.
-
 Condition
Displays the event condition.
-
 Server
Displays the server on which the event has been set.
-
 Edit and Copy
-
By selecting
 , you can modify the saved event settings.
 -
By selecting
 , you can copy the event to other infrastructure.
-
-
For more information about addition of Metrics events, see the following.
-
For addition of Anomaly detection events, see the following.
-
For addition of Log events, see the following.
Enhance your field-centered user experience by trying out the Event Configuration New menu.
-
Notifications can be sent to desired users by setting Recipient tags.
-
You can quickly and easily set desired alert notification events through predefined templates.
-
The Simulation feature allows you to predict the outcome of events.
It can be checked in the ![]() Sitemap > Alert > Event Configuration
Sitemap > Alert > Event Configuration New menu path. For more information about the basic event configuration, see the following.
Adding a server event
Home > Select Project > Alert > Event Configuration > Server tab > Select + Add alert settings
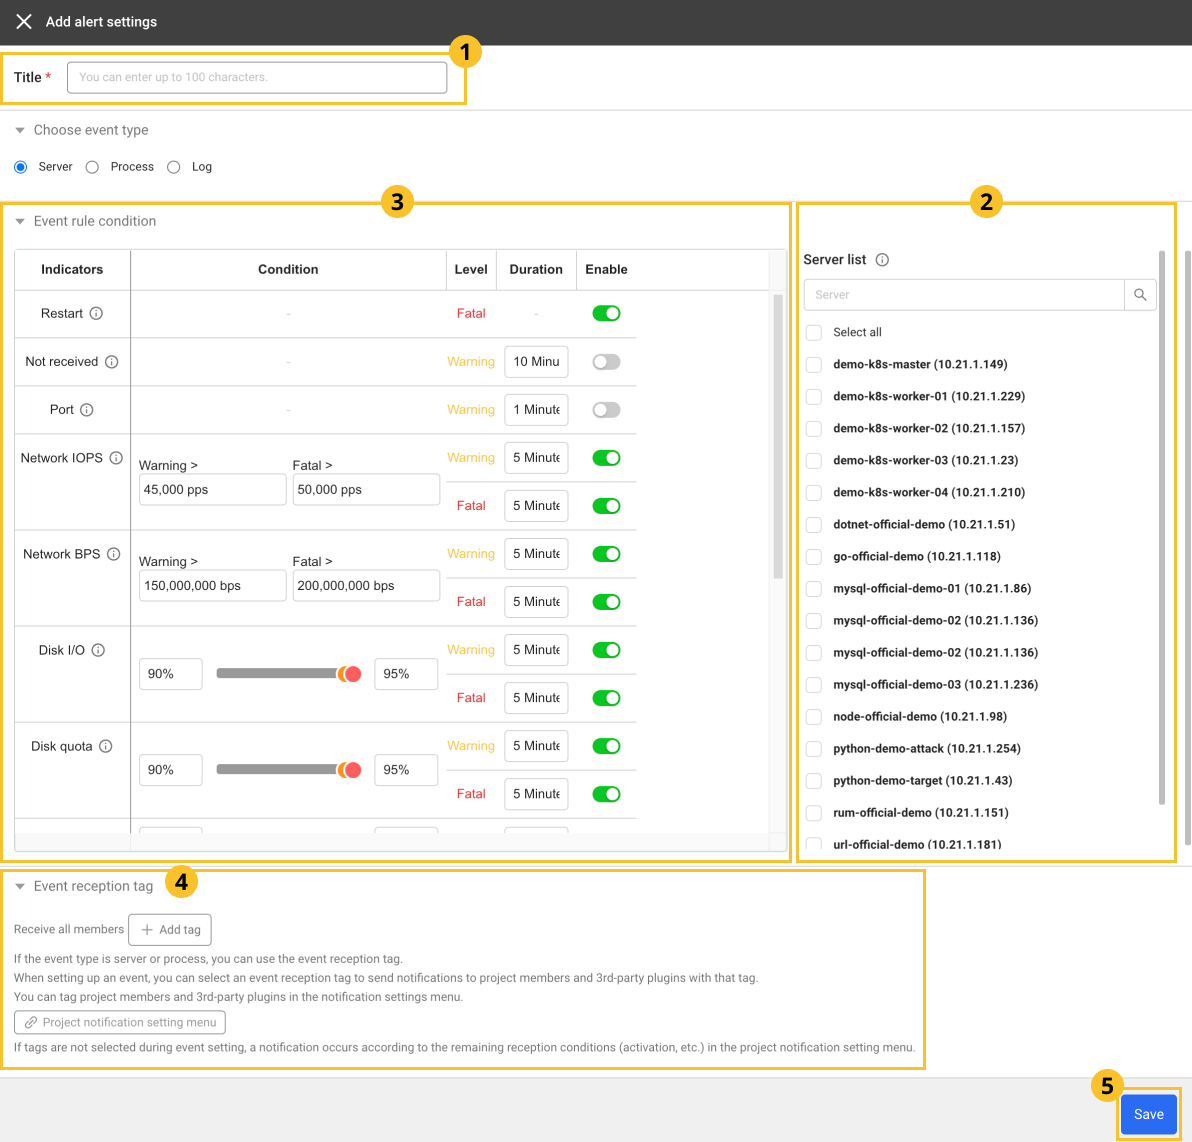
You can receive alerts by setting the global events for specific servers.
-
If the Add alert settings window appears, enter the
event Title. -
Check the
Server list or select a desired server for monitoring through the search bar. -
In the
Event rule condition tab, set the Condition, Level, Duration, and Enable of the desired Indicators.-
Level: You can select a level of Warning and Fatal.
-
Duration: After the set Duration, the server status is set to Warning or Fatal.
For guide to Indicators, see the following.
-
Restart: This event occurs when the server restarts.
-
Not received: This is a communication failure event that occurs when normal data is not received from the agent for the Duration.
-
Port: Port access unavailable event. Registered agents in the project check each other's status through 10120 port. This event occurs when communication fails for the Duration.
-
CPU, Memory, Swap: Set the usage events such as CPU, memory, and SWAP memory.
-
steal: Set the event for CPU steal time. Only Linux-based OS can be set.
-
Disk I/O, Disk quota, inode: Set the event based on the disk usage, I/O usage, and Inode usage.
-
Network IOPS, Network BPS: Set the network usage-related event. It can be set based on the traffic and packets per second.
-
-
Set the
Event reception tag.-
If this tag is selected, notifications can be sent to project members and 3rd-party plug-ins with the corresponding tags. If the event receiving tag is not selected, alerts are sent to all project members.
-
Click + Add tag and then select target alert receivers in Tag list. You can also select + Create new tag to add new tags.
-
In Alert > Notification setting, you can set the tags in project members and 3rd-party plug-ins. For more information about Notification setting, see the following.
-
-
If you finished the event configuration, select
Save.
One event can be assigned to a server.
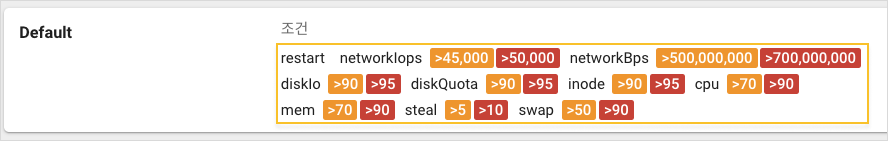
Default settings of server event
WhaTap server monitoring service provides the following basic event settings after agent installation.
-
Restart: Enable
-
Network IOPS
- Warning: 45,000 pps/duration: 5 minutes
- Fatal: 50,000 pps/duration: 5 minutes
-
Network BPS
- Warning: 5000,000 bps/duration: 5 minutes
- Fatal: 7000,000 bps/duration: 5 minutes
-
Disk I/O
- Warning: 90%/duration: 5 minutes
- Fatal: 95%/duration: 5 minutes
-
Disk quota
- Warning: 90%/duration: 5 minutes
- Fatal: 95%/duration: 5 minutes
-
inode
- Warning: 90%/duration: 5 minutes
- Fatal: 95%/duration: 5 minutes
-
CPU
- Warning: 70%/duration: 1 minute
- Fatal: 90%/duration: 1 minute
-
Memory
- Warning: 70%/duration: 1 minute
- Fatal: 90%/duration: 1 minute
-
steal
- Warning: 5%/duration: 1 minute
- Fatal: 10%/duration: 1 minutes
-
Swap
- Warning: 50%/duration: 1 minute
- Fatal: 90%/duration: 1 minute
Adding process event
Home > Select Project > Alert > Event Configuration > Process tab > Select + Add alert settings
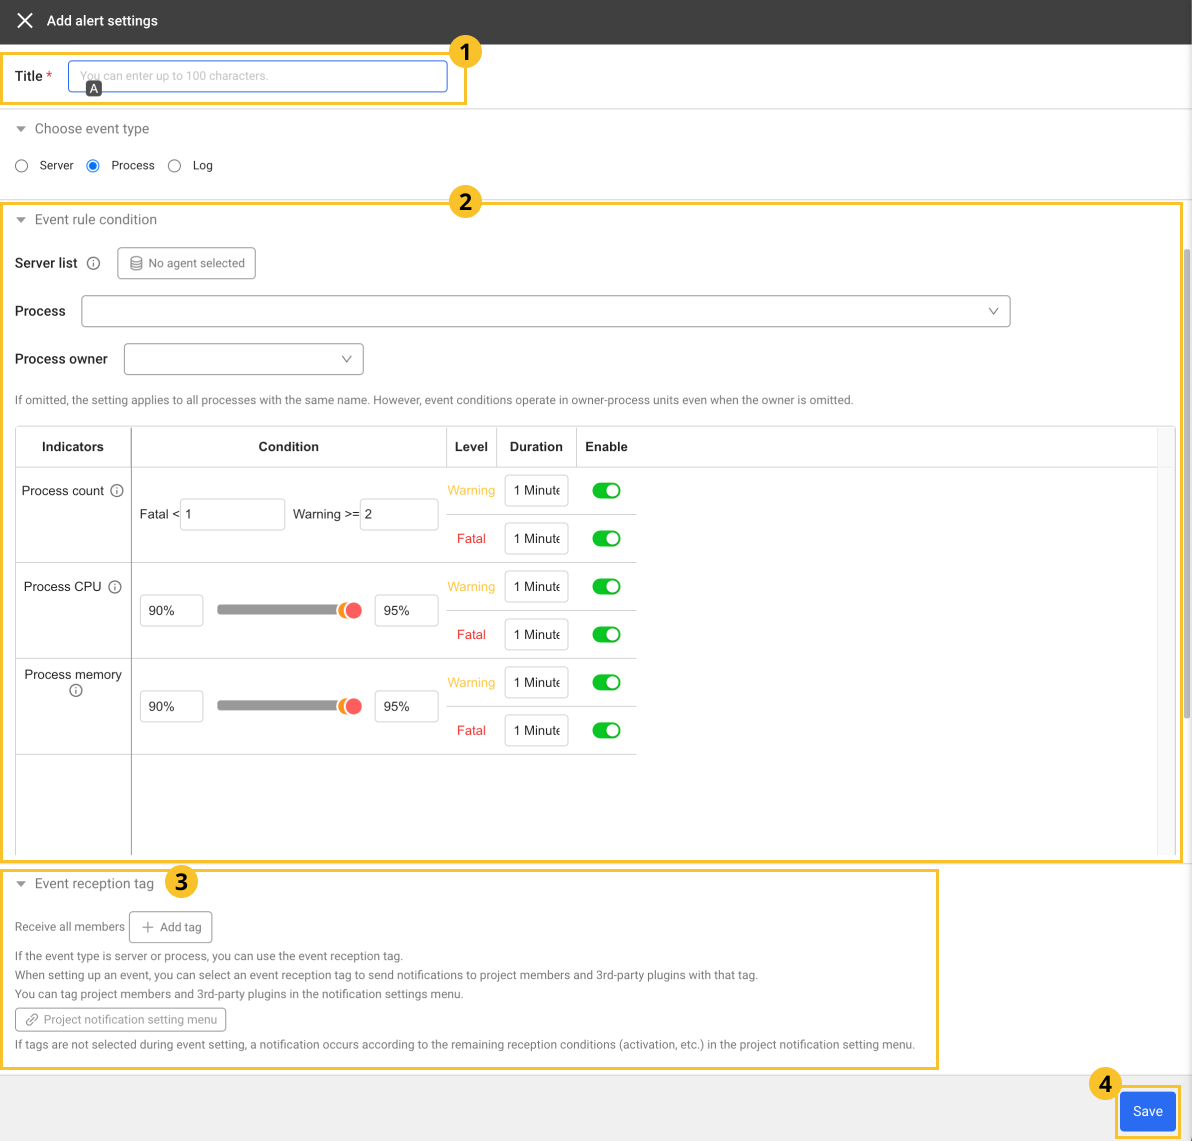
You can receive alerts by setting the events for specific processes. If you specify conditions based on the key metrics such as Process count, Process CPU usage, and Process memory usage, you can prevent the processes from terminating unexpectedly or experiencing rapid performance fluctuations. By doing so, you can receive alerts in real time.
You can assess the severity of events by setting the warning and critical levels and the Duration for which the set thresholds remain in effect. You can also send alerts to specific project members by using the Event reception tag. This allows you to efficiently take prioritized actions.
-
If the Add alert settings window appears, enter the
event Title. -
In the
Event rule condition tab, click No agent selected under the Server list and then select a server from the Server list window.NoteWhen enabling the Project Default Policy option
 , apply the default alert policy to the project administration server.
 -
In the Process selection window, select a process or process group.
NoteFor more information about addition of a process group, see the following.
-
Select Process owner.
- If no Process owner has been assigned, the settings are applied to all processes with the same name regardless of the owner.
- Event conditions work on the owner-process unit basis, even if the Process owner is omitted.
-
Set the Level, Duration, and Enable for the desired Indicators.
-
Level: You can select a level of Warning and Fatal.
-
Duration: After the threshold's Duration, the server status is set to Warning or Fatal.
For guide to Indicators, see the following.
- Process count: You can set an event for the number of processes with the same name. Set the number of Fatal and Warning conditions.
- Process CPU: You can set the events depending on the CPU usage.
- Process memory: You can set the events depending on the memory usage.
-
-
Set the
Event reception tag.-
If this tag is selected, notifications can be sent to project members and 3rd-party plug-ins with the corresponding tags. If the event receiving tag is not selected, alerts are sent to all project members.
-
Click + Add tag and then select target alert receivers in Tag list. You can also select + Create new tag to add new tags.
-
In Alert > Notification setting, you can set the tags in project members and 3rd-party plug-ins. For more information about Notification setting, see the following.
-
-
If you finished the event configuration, select
Save.
- If you set the process alert Condition incorrectly, disable it or set the alert Condition again.
- If you have incorrectly set the Process and Process owner, disable these alerts to cancel activation, and then set the alert conditions again.
Adding the log files and Windows events
Home > Select Project > Alert > Event Configuration > Log File / Window Event tab > Select + Add alert settings
You can manage specific log files and Windows event settings.
Log File
To add a Log file event, set the Event rule seeing the following.
-
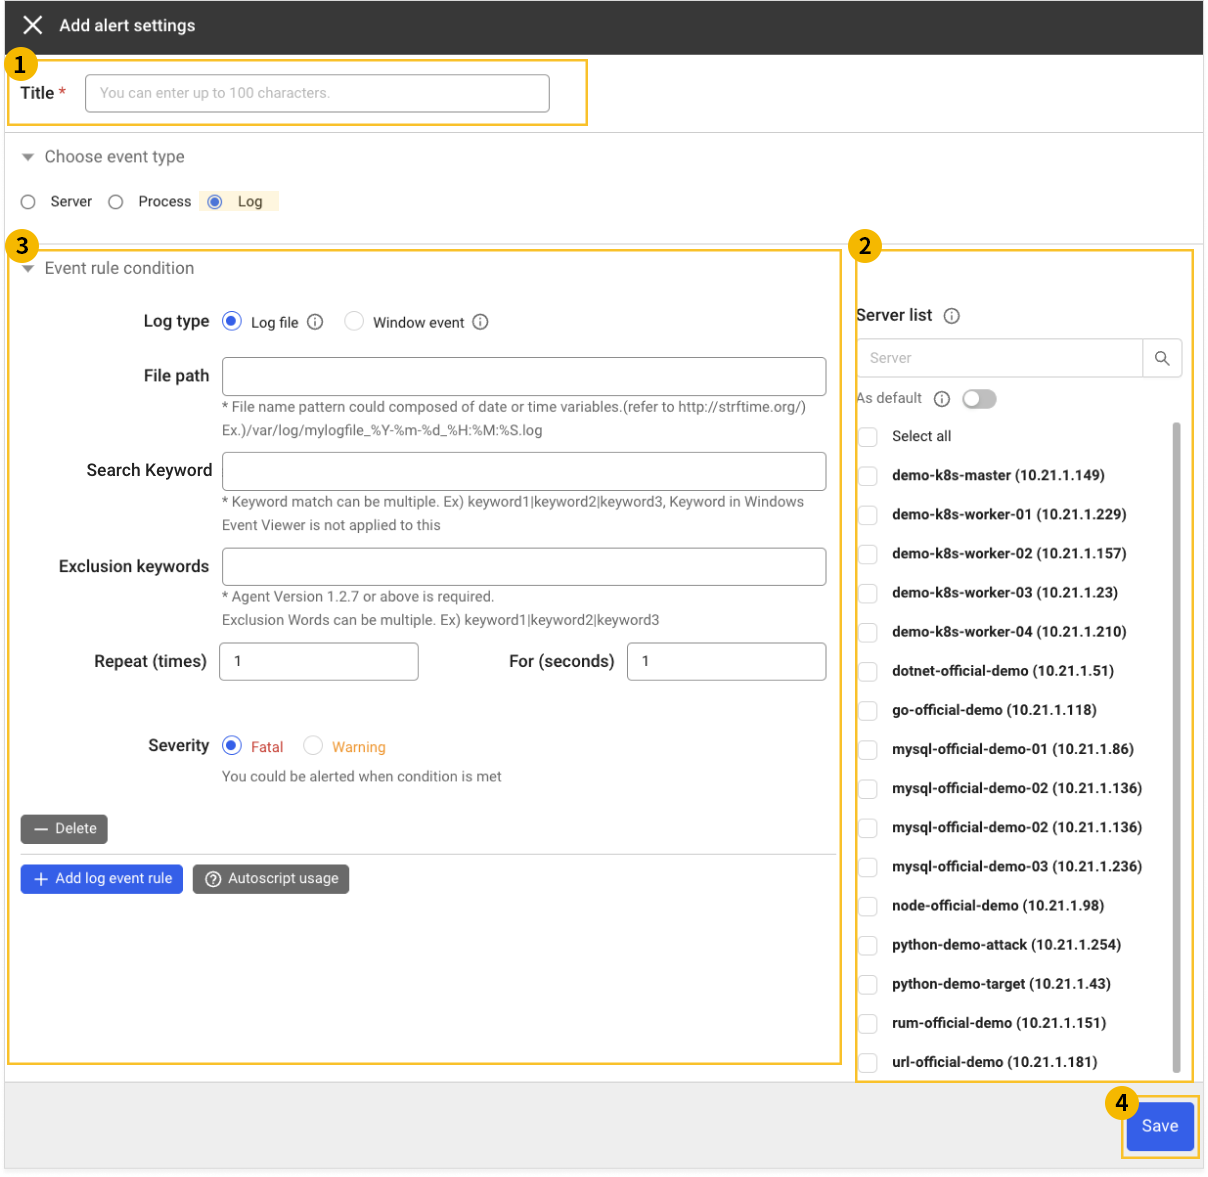
If the Add alert settings window appears, enter the
event Title. -
Check the
Server list or select a desired server for monitoring through the search bar.NoteWhen enabling the Project Default Policy option
, apply the default alert policy to the project administration server. -
In the Event rule condition tab, select Log file in Log type.
-
See the example and then enter the File path following a regular expression rule.
e.g. /var/log/mylogfile%Y-%m-%d_%H:%M:%S.log_
-
Enter the Search Keyword to trigger events. Multiple items can be specified.
-
Enter the Exclusion keywords to be excluded from alerts. Multiple items can be specified.
-
Enter the Repeat and For for alerts how many seconds and how many times when detecting the specified keyword.
-
Select an event Severity. You can set the level of Fatal or Warning.
-
Select
Save.
Window Event
To add an Window event, set the Event rule seeing the following. It is available only in the Windows environment.
-
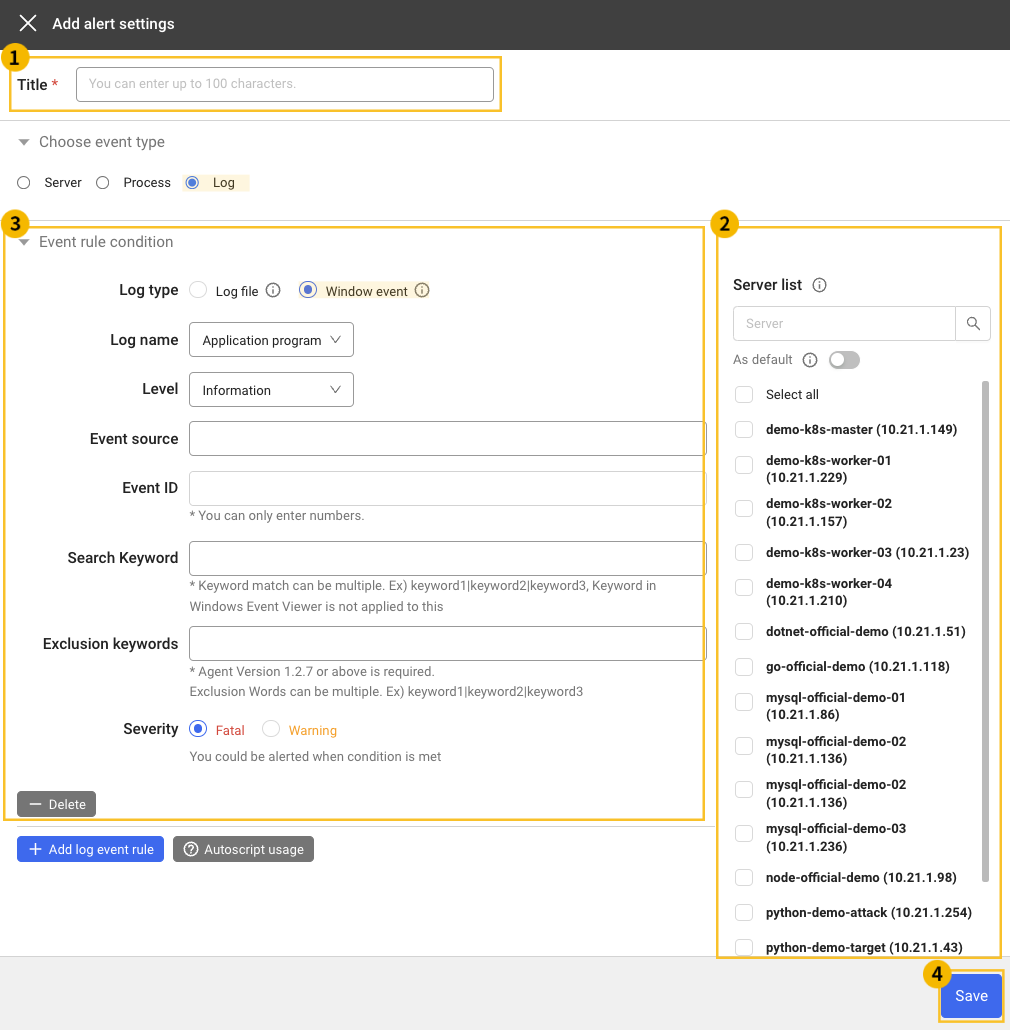
If the Add alert settings window appears, enter the
event Title. -
Check the
Server list or select a desired server for monitoring through the search bar.NoteWhen enabling the Project Default Policy option
, apply the default alert policy to the project administration server. -
In the Event rule condition tab, select Window event in Log type.
-
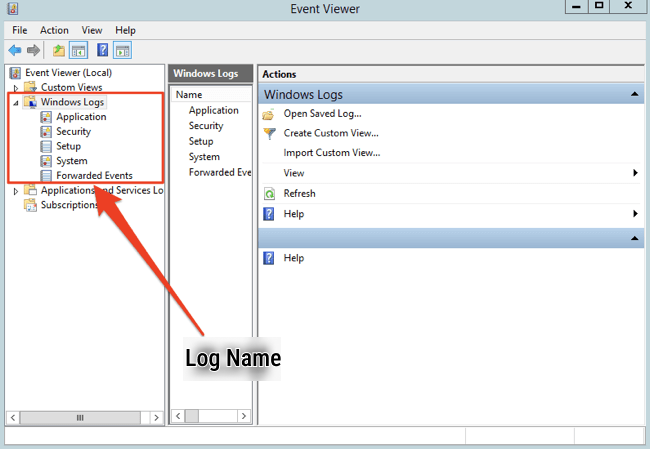
Select Log name by referencing the following example.
-
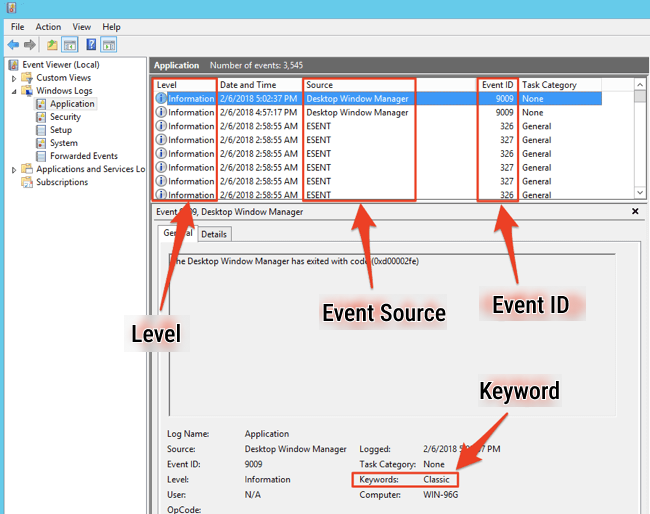
Noting the following example, set the values for Level, Event source, Event ID, and Search Keyword. For the Search Keyword, multiple items can be specified.
-
Enter the Exclusion keywords to be excluded from alerts. Multiple items can be specified.
-
Select an event Severity. You can set the level of Fatal or Warning.
-
Select
Save.
Log File Throughput
The file log throughput is set as follows based on the log lines. This is to prevent excessive CPU use of the WhaTap server monitoring agent when too many logs occur. Excessive amount is not processed.
- Version 1.3.6 or earlier: Exceeding 60 lines per 2 seconds are processed.
- Version 1.3.7 or later: Exceeding 1000 lines per 2 seconds are processed.
You can adjust the excess per 2 seconds with the following option.
-
Linux
log.skip.threshold=number of lines that can be processed per 2 secondsin the /usr/whatap/infra/conf/whatap.conf file -
Windows
log.skip.threshold=number of lines that can be processed per 2 secondsin the C:\Program Files\WhatapInfra\whatap.conf file
Modifying an event
-
On the right of the event list, select
Edit. -
In the Event rule condition tab, modify the Condition, Level, Duration, and Enable of the desired Indicators.
-
After modification, select Save.
- If there is any modification for a specific metric, all active alerts for the metric are disabled.
- After modification, a new alert is triggered when any data for the set conditions is received.
- If any process alert data of Title, Process, and Process owner has been modified, all alerts for the condition are disabled.
Deleting an event
-
On the right of the event list, select
Edit. -
On the upper right of the modification screen, select
 Delete.
Copying an event
-
On the right of the event list, select
Copy. -
When the Copying event settings window appears, select a desired project or select Copy to Current Project at the bottom.
-
If a project to copy the event settings to has been set, select Copy.
-
When duplicate events are copied within the same project, as many events as the number of copies are created.
-
The copied event name is added with the suffix (copy).
e.g. Previous event name Default → Copied event name Default(copy)