Event History
Home > Select Project > Alert > Event History
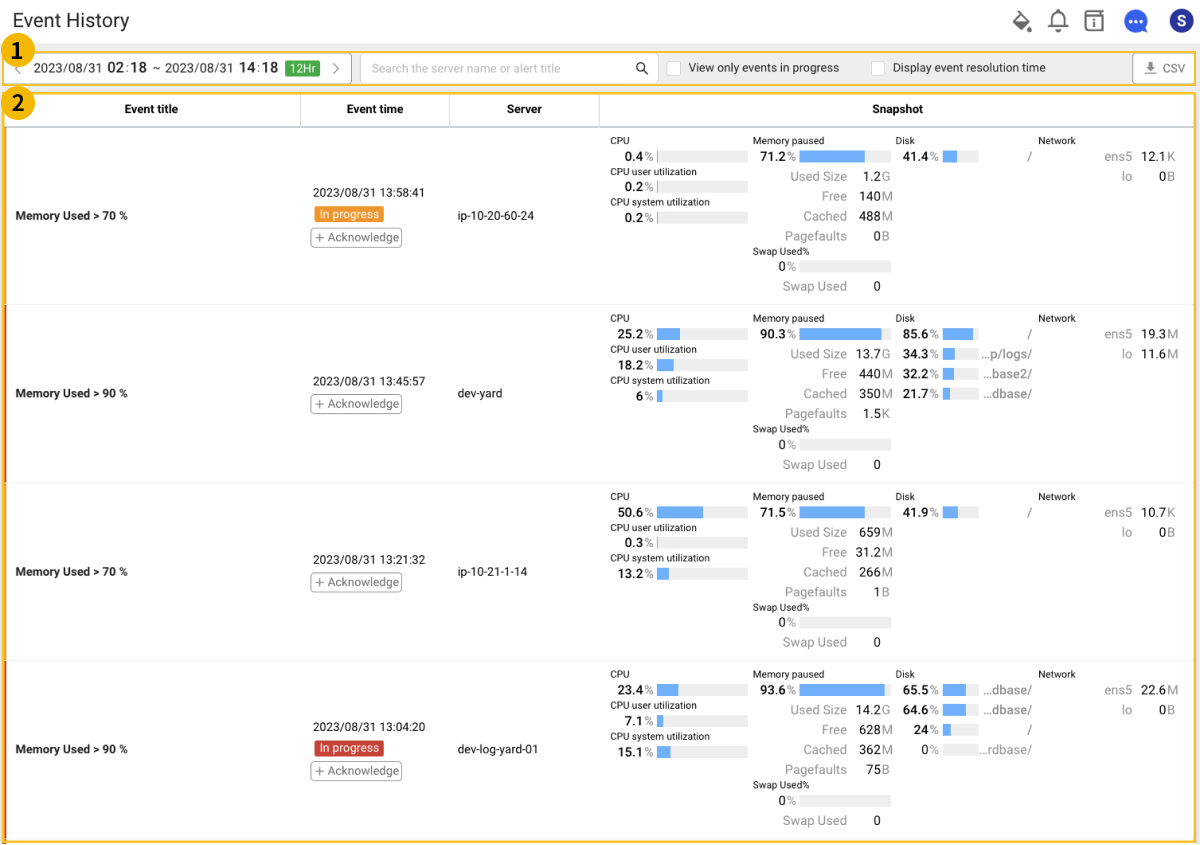
You can check the history of alerts. You can see a list of all events that have occurred.
Basic screen guide

 User configuration
-
Time selector
-
You can select a lookup time by selecting the green button on the right. The default setting is 12 hours.
-
By selecting
or
, you can move by the selected inquiry time range.
-
To select a detailed time, select a date or time zone. Set the detailed time and then select Apply.
NoteFor more information on how to use the time selector, see the following.
-
-
Input field
You can search by server name or event name in the input field.
-
View only events in progress
You can only see progress events in the event history list.
-
Display event resolution time
In the event history list, the Event resolution time column can be added.
NoteIn an active event, the Event resolution time is not viewed.
-
CSV
You can save the viewed event records as a CSV file. Enter the Maximum CSV lines and then select Download.
 Event History List
-
Severity
The severity is displayed in colors for Fatal, Warning.
-
Event title
The name of the event occurred based on the value set in the event policy.
-
Event time
Event occurrence time.
-
Acknowledge
The event processing history can be added.
CautionWhen you register the processing history, the Recurring alert (escalation) of the event is suspended. For more information about Recurring alert (escalation), see the following.
-
Server
Server name.
-
Snapshot
Snapshot information of CPU, Memory paused, Disk, and Network for the occurred events.
Event Detail Info
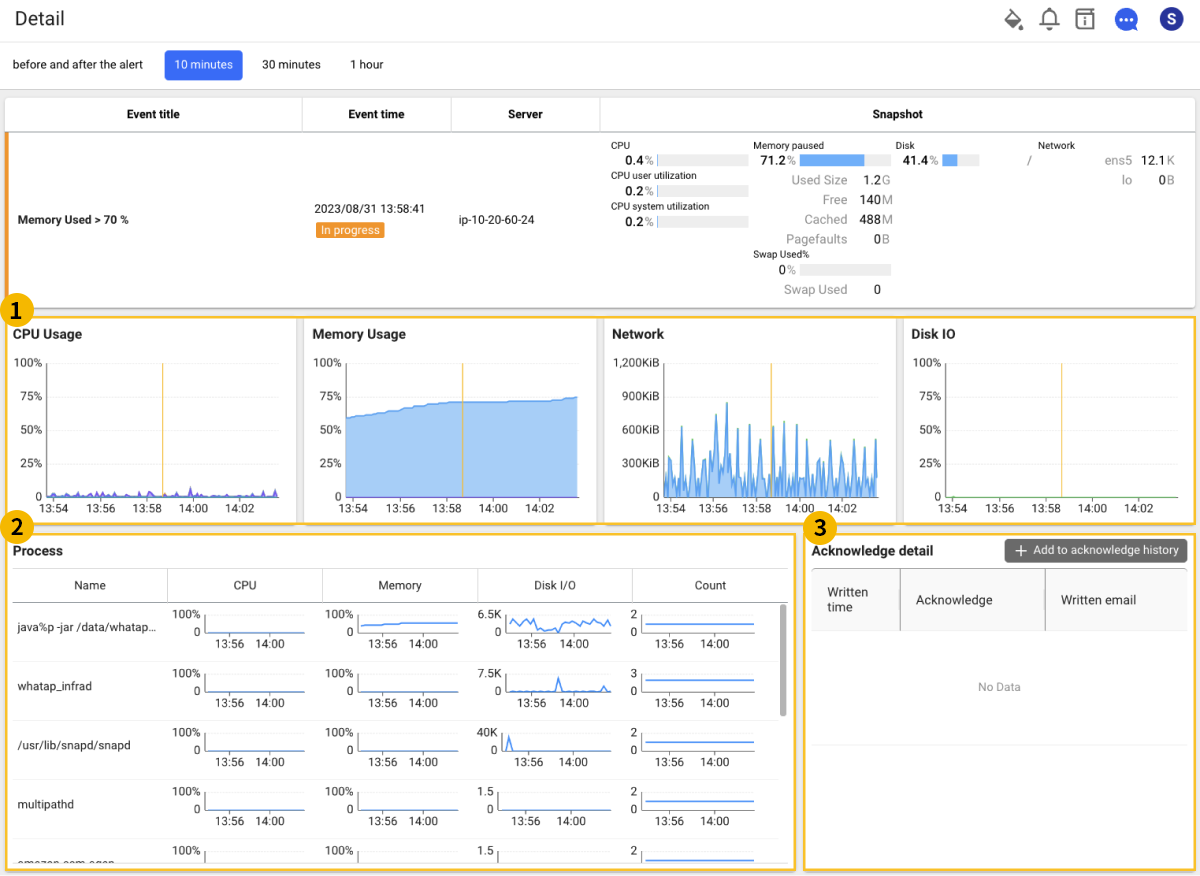
If you select Event title in the event history list, it goes to the Detail information for 5 minutes before and after the event.

 ** Chart Widget**
It displays the CPU Usage, Memory Usage, Network, and Disk IO charts before and after the alarm. The Severity of the event part appears.
 Process
You can view the top 10 processes for the event.
 Acknowledge detail
The event process records can be viewed. If you select Add to acknowledge history, you can write and save the history.