Server List
Home > Select Project > Server List > Server List
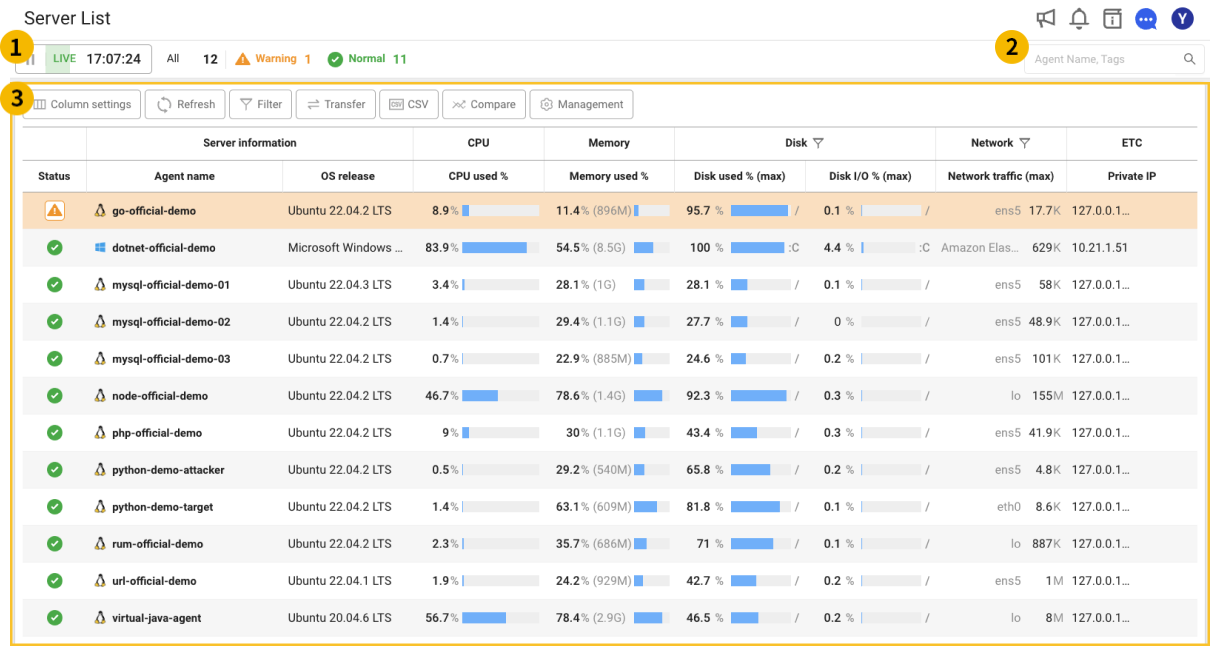
Select a project in the initial screen of the WhaTap monitoring service, and then select Server List > Server List under Project Menu. The Server List displays the overall status of the collection server and provides the comparison functions between server management functions and between servers.
 Data refreshing and server status
Data update
The data on the server list page is automatically updated every 60 seconds.
-
 Pause : You can stop automatic update of the data.
 -
 Playback : You can restart the auto update you have stopped.
For more information on how to use the time selector, see the following.
Server Status
It displays the current status of the collection server by status. The status is updated every 1 minute.
-
 Inactive: The agent cannot collect data from the server.
 -
 Fatal: Any fatal events occur in the collection server.
 -
 Warning: Any warning events occur in the collection server.
 -
 Normal: The agent is running normally in the collection server.
 -
Paused: The agent temporarily paused collecting data.
 Searching
Using the ![]() search bar at the upper right corner, you can filter the list of servers that include input values from the server name (ONAME), server ID (OID), and tags.
search bar at the upper right corner, you can filter the list of servers that include input values from the server name (ONAME), server ID (OID), and tags.
 Server Status
It displays the status of all servers to which agents are assigned. If an agent is selected in the list, the Server Detail page appears. For more information about Server Detail, see the following.
Column Settings
-
 Column settings In the menu at the top, if you click Column settings, you can select columns to displays in the table as follows.
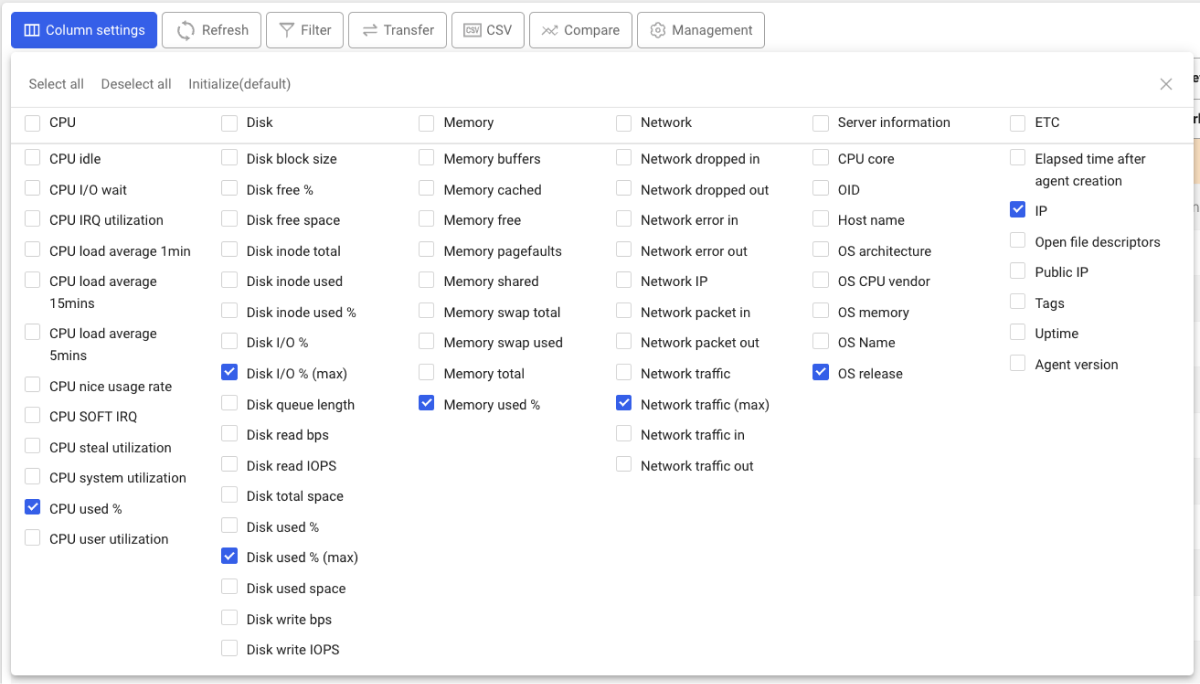 Note
NoteThe selected Columns are stored as the browser cookie values so that the status is maintained after refreshing the page. If an error occurs between settings due to cookie deletion or other reasons, it is initialized to the full selection state.
-
Column Width Setting
You can set the column width by dragging the edge of the column title.
-
Align Columns
Sort Columns By clicking the column title, you can sort in ascending or descending order.
NoteThe settings for Columns Width and Columns Align are stored in the browser cookies and the status is maintained after refreshing the page. If an error occurs between settings due to cookie deletion or other reasons, it is initialized to the unset state.
Refresh
If you click ![]() Refresh, the data is updated based on the current time.
Refresh, the data is updated based on the current time.
Filtering
![]() If you click
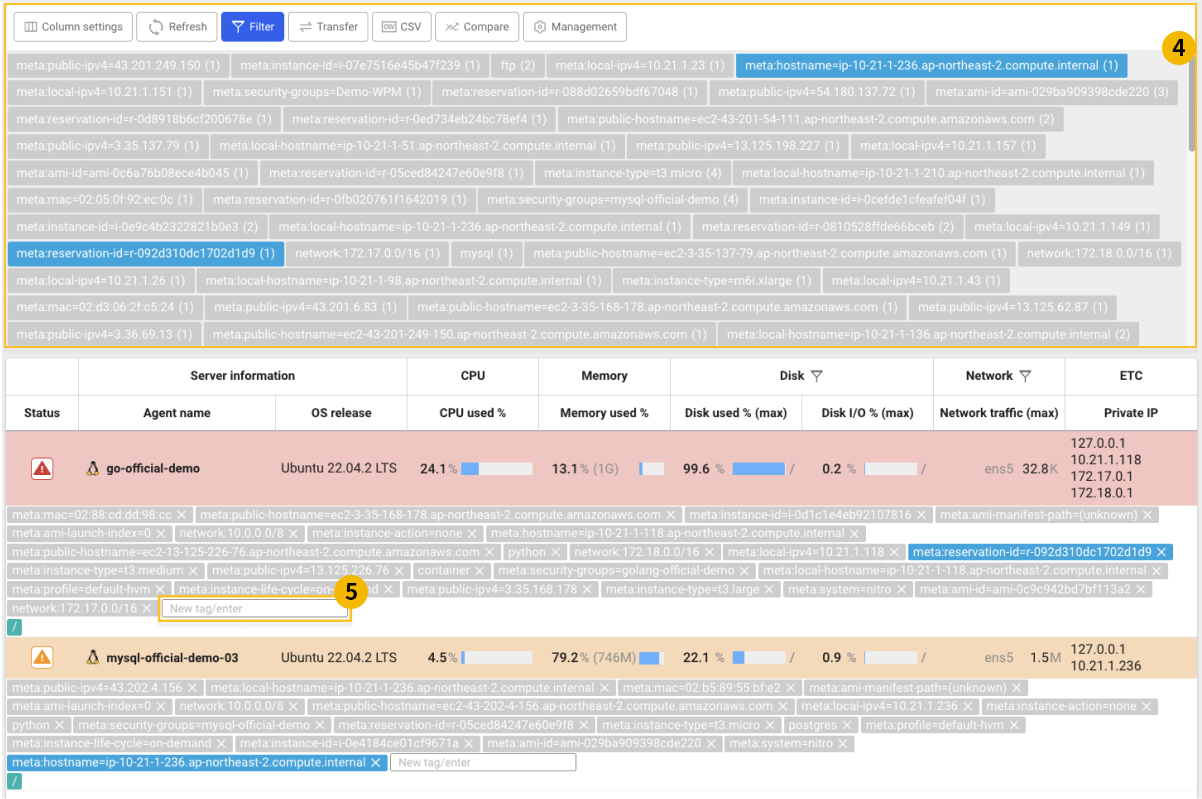
If you click ![]() Filter in the menu at the top, you can filter servers by using the tags.
Filter in the menu at the top, you can filter servers by using the tags.
Tags are automatically assigned when installing the agent. You can add input values. It identifies collection servers or filter the server status through tags.
-
 By selecting a tag in the area, you can filter servers.
 -
You can enable new tag features by entering tags for each agent. Check the input field in the
 area.
area.
Monitoring Management
This function manages servers through agent commands. Click ![]() Management and then select a server to apply the management features from the list. On the right, Pause, Restart, and Delete buttons are activated.
Management and then select a server to apply the management features from the list. On the right, Pause, Restart, and Delete buttons are activated.
-
Pause: Data collection for the agent is paused. It is displayed as the paused state in the server list.
-
 Restart: The agent is restarted.
 -
 Delete: The agent operation is stopped. It is excluded from the server list and the server status cannot be checked.
Agent Transfer
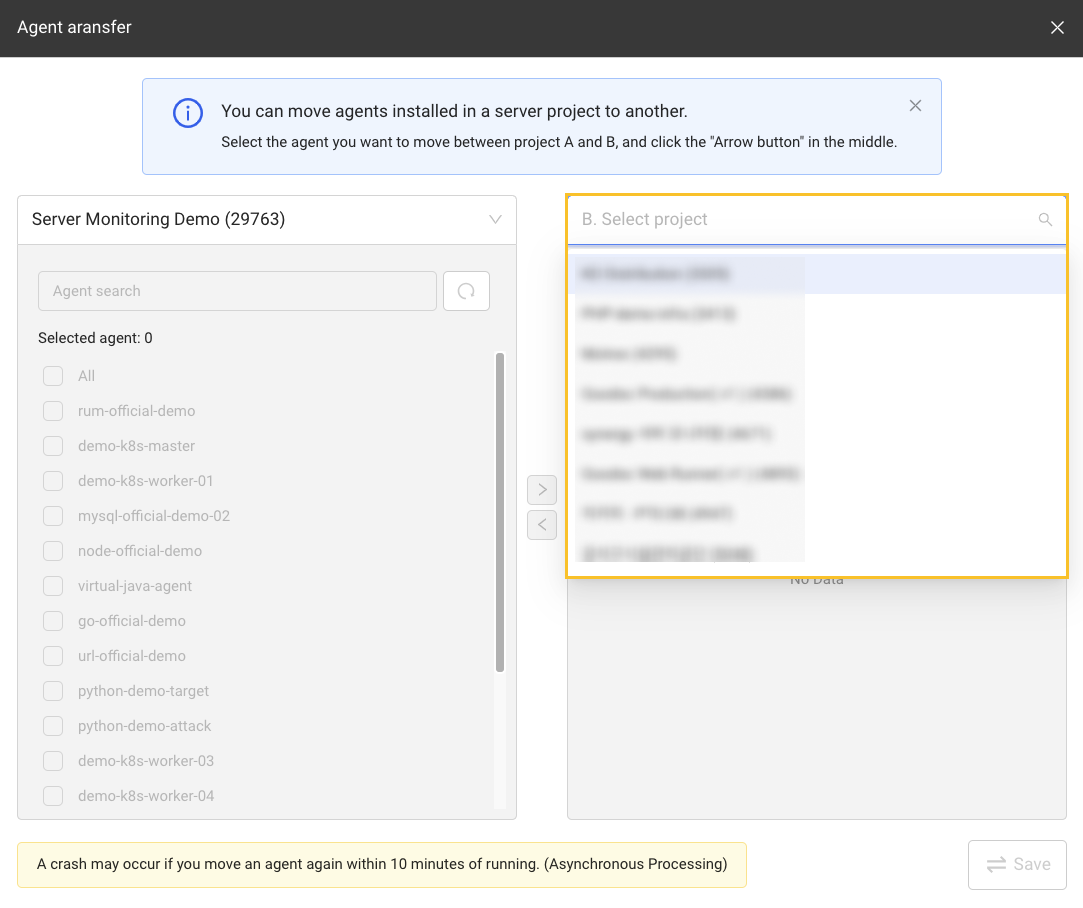
By selecting ![]() Transfer, you can transfer the agent to another project.
Transfer, you can transfer the agent to another project.
-
Select a project to transfer on the right screen.
-
Select an agent to transfer on the left screen.
-
By clicking
 Right arrow, you can transfer to the target project.
 -
If you click Save, the transfer is completed.
- If you move the same agent again within 10 minutes just after execution, it may cause a conflict.
- The collected data is not transferred. Do not delete the existing projects for a while to retrieve the past data.
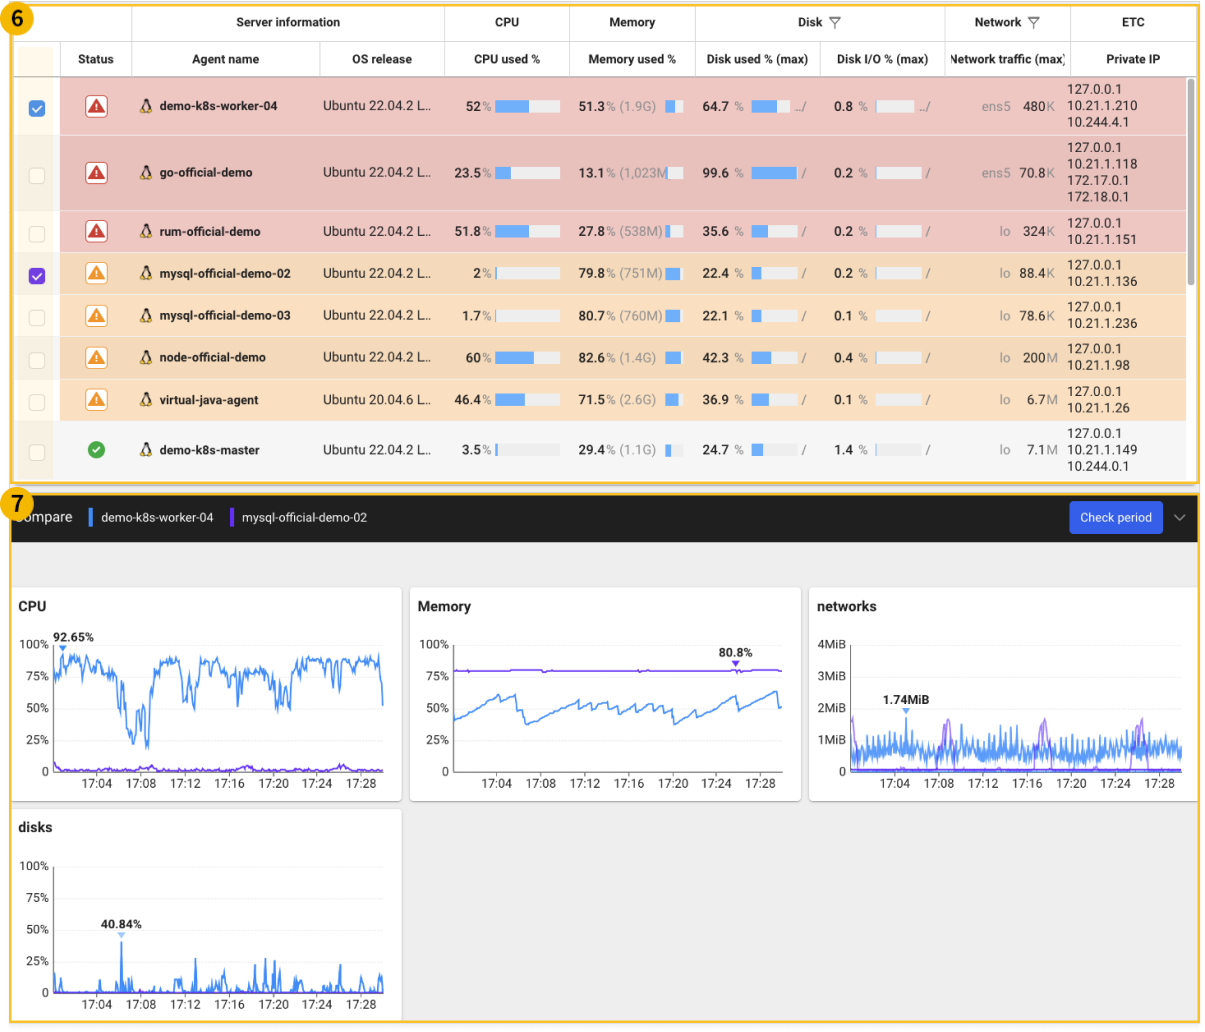
Comparison between servers
If you click ![]() Compare, the cross-server comparison chart is provided as follows.
Compare, the cross-server comparison chart is provided as follows.
-
Select
 Compare.
 -
Like
 , check whether the Compare column has been added on the left of the server list.
 -
In the Compare column, select a server for comparison..
-
To enable the comparison function, you can see the chart to compare in the
 area.
area.
-
The comparison servers can be selected up to 5.
-
Unique colors are assigned to each server. The unique colors are used to distinguish servers in
Compare. -
If you select Check period, the past data can be retrieved.