Server inventory map grouping
Home > Select Project > Dashboard > Server Inventory Map
In the Server Inventory Map dashboard, you can see the entire server information at a glance based on the columns set in the Server Inventory menu. However, when monitoring the server status and information, the criteria that each user considers important may differ. By reflecting this, Server Inventory Map provides the feature to group the data based on user concerns.
For example, application managers focus on the status for server groups or individual servers that relate to a specific service, while infrastructure administrators are primarily interested in server hardware configuration information and resource utilization. The administrators may want to analyze the server status based on resource changes or key events over a specific period.
To accommodate various perspectives and needs, Server Inventory Map provides the flexible grouping feature. This allows users to reorganize data according to their interests, allowing them to monitor and manage the server status more efficiently.

Grouping & Card
Server Inventory Map provides cards by grouped server configuration information. When grouping is not applied, all server information is displayed within a single card. When applying grouping, cards are organized by each group unit.
When applying grouping, you can classify servers by sequentially selecting 1st group and 2nd group. According to the primary and secondary grouping, 1st group classifies data in card format, and 2nd group presents each grouped data in subgroup format in the chart area within cards.
-
1st group: The primary group displays data based on the group category and group name.
e.g.
Infra_domainALL -
2nd group: Secondary groups are displayed based on the group name and number of servers in the group.
e.g. Finance (31)
-
If you hover over a server group or server, you can briefly check the major status of the group and server in a popover format.
-
When you select Not set among the grouping selection items, the grouping definition is initialized.
Key grouping properties
Based on Server Inventory, the default collection items and custom items among the columns that can be searched appear in the Grouping list. The default collection items are server type, default group, OS type, OS version, model, and serial.
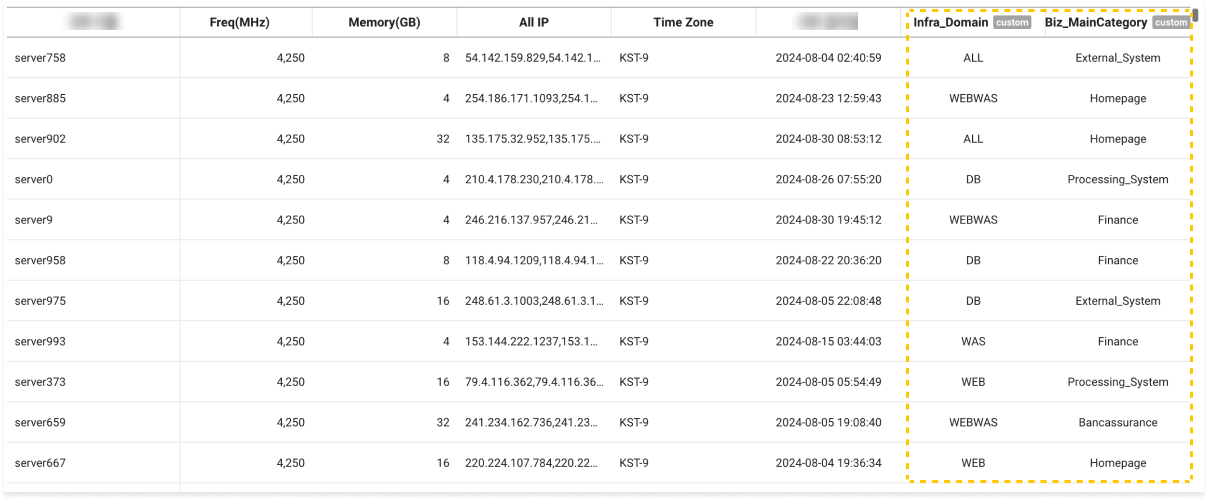
Other items such as infrastructure domain (Infra_Domain) and business major category (Biz_MainCategory) that can be seen in the example image, are user-defined items added through the custom column (custom) in the Server Inventory menu.
You can further refine the view by primary grouping servers with the infrastructure domain based on physical or logical configuration, and then secondary grouping them based on business-based major classification for business purposes, through custom items.

The example image displays the infrastructure domains in the Server Inventory menu sorted by the values such as DB, WAS, WEB, WEBWAS, and ALL, which includes custom infrastructure domains. Additionally, the business-based major classification items have been classified into values such as External_System, Processing_System, and Finance.
Based on this information, you can configure the Server Inventory Map dashboard to monitor the overall operation status.
Metrics data by card
Below each card, a brief overview of key metrics information about the grouped servers is provided. For more information about each metric, see the following table.
| Type | Description |
|---|---|
| CPU(%) | It displays the sum of the utilization in user mode (User) and kernel mode (Sys) out of the total CPU utilization. |
| Memory(%) | It displays the memory rate used by user processes and kernels, excluding the buffer and cache areas. |
| Swap(%) | It displays the size of the swap area in use as a percentage. |
| Disk Busy(%) | It is the rate of the time processed for each disk per unit time, and displays the value for the most utilized disk on the server. |
| Network RX | It displays the amount of received (Rx) data in bps. |
| Network TX | It displays the amount of transmitted (Tx) data in bps. |
-
Avg: It displays the average metric value for all servers that belong to the group.
-
Max: It displays the maximum value of the metric.
-
Max Server: It displays the name of the server that recorded the maximum value.