Server inventory map
Home > Select Project > Dashboard > Server Inventory Map
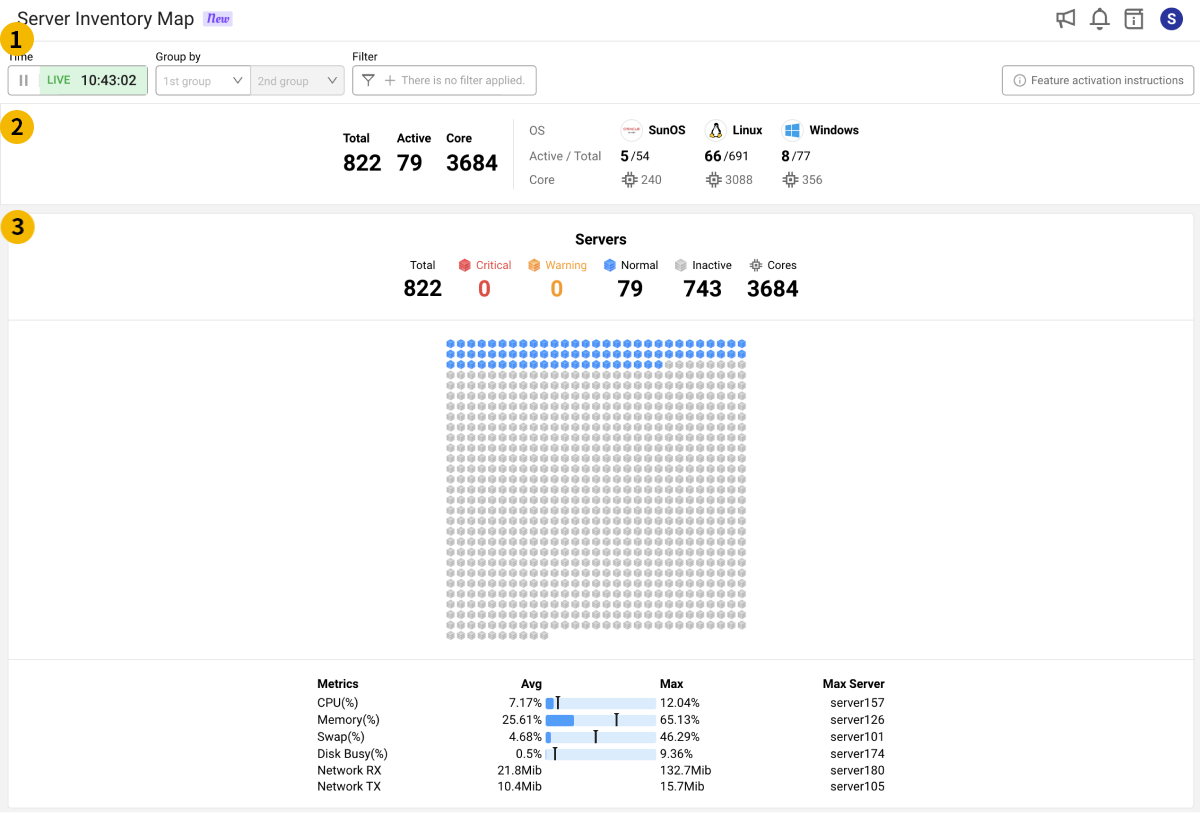
On the initial screen of the WhaTap monitoring service, select a project, and then select the Server Inventory Map menu under the Dashboard menu. Server Inventory Map is a visualization dashboard that allows administrators to group and organize servers based on the classification criteria for monitoring purposes based on Server Inventory.
WhaTap allows users to intuitively check and analyze the server operation status through Server Inventory Map. The administrators can add and manage the user-defined information such as work classification, person in charge, and server location as custom columns, and easily create visualized dashboards based on this. Server Inventory Map also provides the grouping feature to meet different perspectives for monitoring purposes. Improve the server operation management efficiency through Server Inventory Map.
Requirements
To use the Server Inventory Map dashboard, enable the Server Inventory and Server Inventory Map features respectively. Try out the new Server Inventory Map dashboard along with Server Inventory. For more information about enabling Server Inventory, see the following.
Supported agents
The Server Inventory Map menu is supported in the following versions or later depending on the operating system.
-
Linux: 2.7.2 or later
If an update is needed, check the following commands for each operating system.
- Debian/Ubuntu
- Amazon Linux/RHEL/Fedora/Oracle Linux/CentOS/Rocky Linux/SUSE
sudo apt-get update
sudo apt-get install whatap-infra
sudo yum update whatap-infra -
Unix Solaris: 1.3.6 or later
If an update is needed, check the following command.
cp /usr/whatap/infra/conf/whatap.conf /tmp
/etc/init.d/whatap-infra stop
gunzip -c whatap-infra.latest.SPARC.pkg.tar.gz | tar xvf -
yes n | ./whatap-infra/install.sh
cp /tmp/whatap.conf /usr/whatap/infra/conf/whatap.conf
/etc/init.d/whatap-infra start -
Windows: 2.7.2 or later
Download the installation file through the following link and then run it. After the agent update, the service is restarted.
Activation option
The following settings are required to enable the Server Inventory Map menu viewing feature.
-
Enable the following options in the whatap.conf file.
categoryv2.enabled=true -
After setting additional options according to the environment, restart the agent.
-
Linux
- Add option command
- Restart agent
grep -q '^categoryv2.enabled' /usr/whatap/infra/conf/whatap.conf || echo 'categoryv2.enabled=true' | sudo tee -a /usr/whatap/infra/conf/whatap.confsudo service whatap-infra restart -
Unix Solaris
- Add option command
- Restart agent
Oracle Solarisgrep -q '^categoryv2.enabled' /usr/whatap/infra/conf/whatap.conf || echo 'categoryv2.enabled=true' | tee -a /usr/whatap/infra/conf/whatap.confOracle Solaris/etc/init.d/whatap-infra restart -
Windows
- Add option command
- Restart agent
if (-not (Select-String -Path "C:\Program Files\WhatapInfra\whatap.conf" -Pattern "^categoryv2.enabled" -Quiet)) { Add-Content -Path "C:\Program Files\WhatapInfra\whatap.conf" -Value "categoryv2.enabled=true" }Restart-Service -Name "Whatap Infra"
-
Basic screen guide

 User configuration
Server Inventory Map provides several custom settings that allow you to configure the desired dashboard. You can use the following features.
Real-time inquiry and pausing
Server Inventory Map is basically based on the real-time inquiry. For real-time inquiry and pausing status change, use the time selector on the upper left of the screen.
| Lookup status | Description |
|---|---|
| Real-time inquiry (Live) | Basic mode Interval: 5 seconds |
| Pause inquiry (Pause) | Real-time status change to OFF |
For more information on how to use the time selector, see the following.
Grouping

Server Inventory Map provides the grouping feature that can systematically classify the servers. Manage servers effectively by setting the grouping criteria depending on the monitoring purpose and environment.
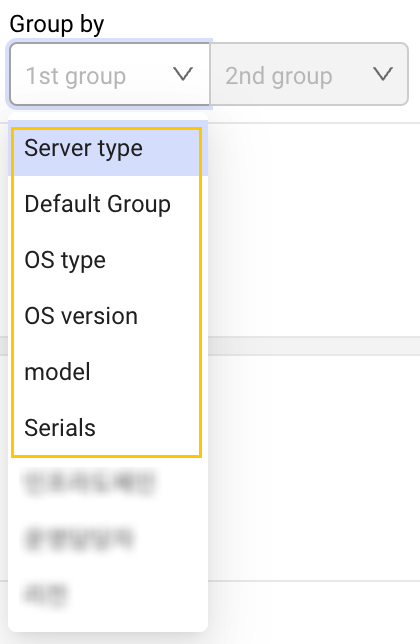
Based on Server Inventory, the default collection items and custom items among the columns that can be searched appear in the Grouping list. The default collection items are server type, default group, OS type, OS version, model, and serial. Other items that can be seen in the example image are custom columns (custom) that are user-defined items.
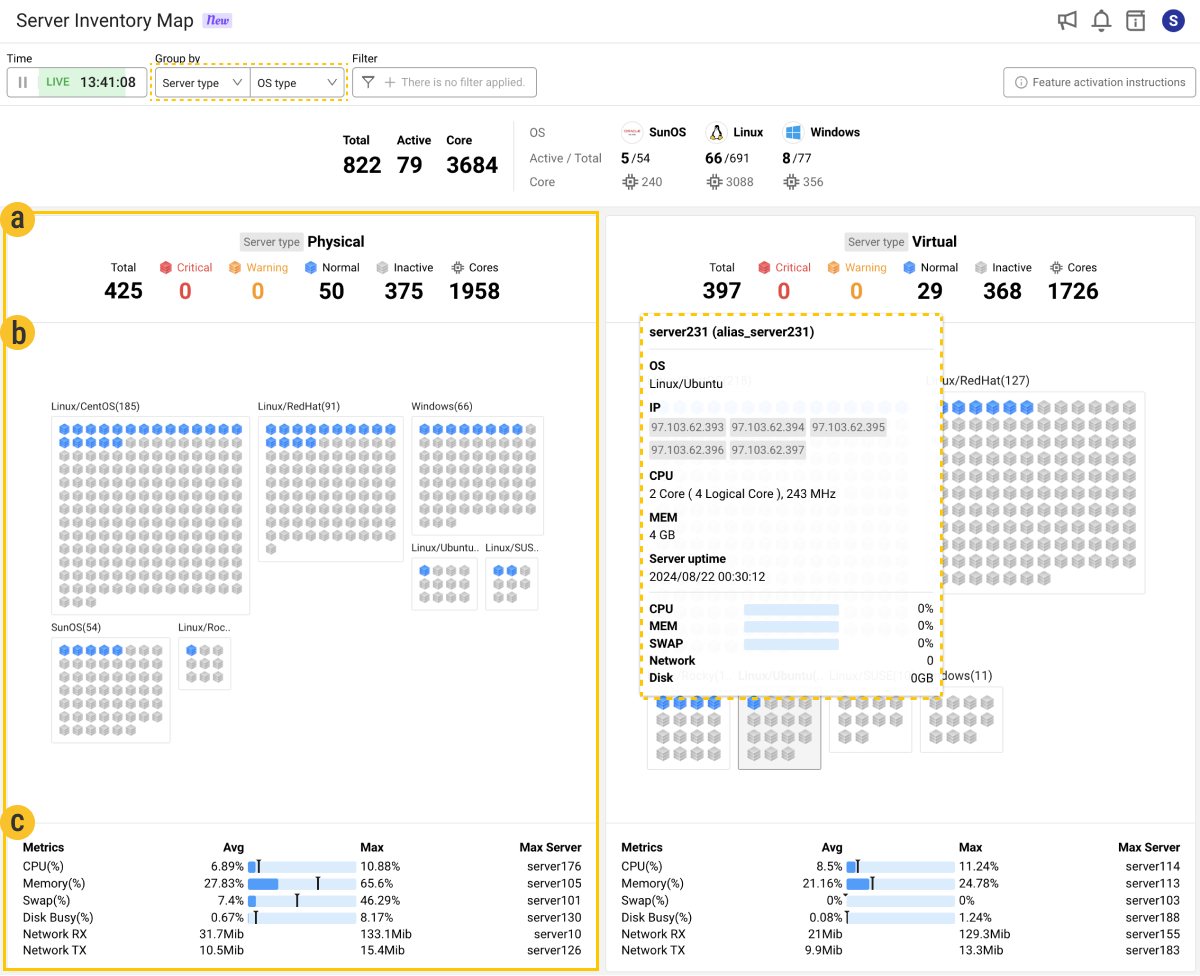
You can classify servers by selecting 1st group and 2nd group sequentially. According to the primary and secondary grouping, in the area, the primary group classifies the data in card format, and the secondary group represents each grouped data in subgroup format in the chart area within cards.
For more information about grouping, see the following.
Filtering
Server Inventory Map provides the feature to filter the server types to display on the dashboard. Data applied through filtering is reflected into the server group chart, summary view, and detailed view.
-
Filter key: Filters can be set based on the default collection columns provided in the Server Inventory menu and user-defined custom columns.
-
Default collection columns: Items automatically collected from Server Inventory are server type, default group, OS type, OS version, model, and serial columns.
-
Custom columns: They are the items added and managed on a project basis.
-
-
Condition: Filter conditions can be set as string conditions such as matched, mismatched, included, and excluded. All filters are string-based, and numeric conditions (e.g.
≥,≤) are not supported.
 Server configuration status
Server Inventory Map provides the server configuration status that allows you to check the configurations for each server operating system of the project at a glance at the top of the dashboard. This allows users to get a quick and intuitive overview of key information about servers in the project.
-
OS: This server operating system displays the OS name along with its OS icon. If an OS that is not predefined is included, the infrastructure icon appears by default.
-
Total / Active: This indicates the total number of servers included in the project and the number of active servers.
-
Core: It displays the sum of physical cores for all servers included in the project.
 Server group card
Server Inventory Map provides individual cards based on the grouped server configuration. The Server Inventory Map card consists of three major elements as follows.

 Group status
It provides the counts for each status of the servers that belong to the group name and group.
| Type | Description |
|---|---|
| Total | It indicates the total number of servers included in the group. Servers are aggregated, categorized, and filtered depending on their purpose. |
| Critical | It indicates the number of servers that generated events for the risk level of Critical. |
| Warning | It indicates the number of servers that generated events for the risk level of Warning. |
| Normal | It indicates the number of servers in normal status in which Critical and Warning events are not generated. |
| Inactive | This indicates the number of servers where normal data collection is impossible due to server down, agent down, network communication failure, and such. |
| Cores | It indicates the total number of cores that is the sum of physical core counts for each server within the group. |
 Server group chart
It provides visualization of the status and performance for servers within the group. When the secondary grouping is applied, data is additionally divided and displayed in subgroup format within the chart. Additionally, if you hover your mouse over a subgroup, you can briefly check the main status of the servers included in the corresponding group in popover format.
 Metrics
It provides brief information on key metrics for each group. For more information about each metric, see the following table.
| Type | Description |
|---|---|
| CPU(%) | It displays the sum of the utilization in user mode (User) and kernel mode (Sys) out of the total CPU utilization. |
| Memory(%) | It displays the memory rate used by user processes and kernels, excluding the buffer and cache areas. |
| Swap(%) | It displays the size of the swap area in use as a percentage. |
| Disk Busy(%) | It is the rate of the time processed for each disk per unit time, and displays the value for the most utilized disk on the server. |
| Network RX | It displays the amount of received (Rx) data in bps. |
| Network TX | It displays the amount of transmitted (Tx) data in bps. |
-
Avg: It displays the average metric value for all servers that belong to the group.
-
Max: It displays the maximum value of the metric.
-
Max Server: It displays the name of the server that recorded the maximum value.
Summary view
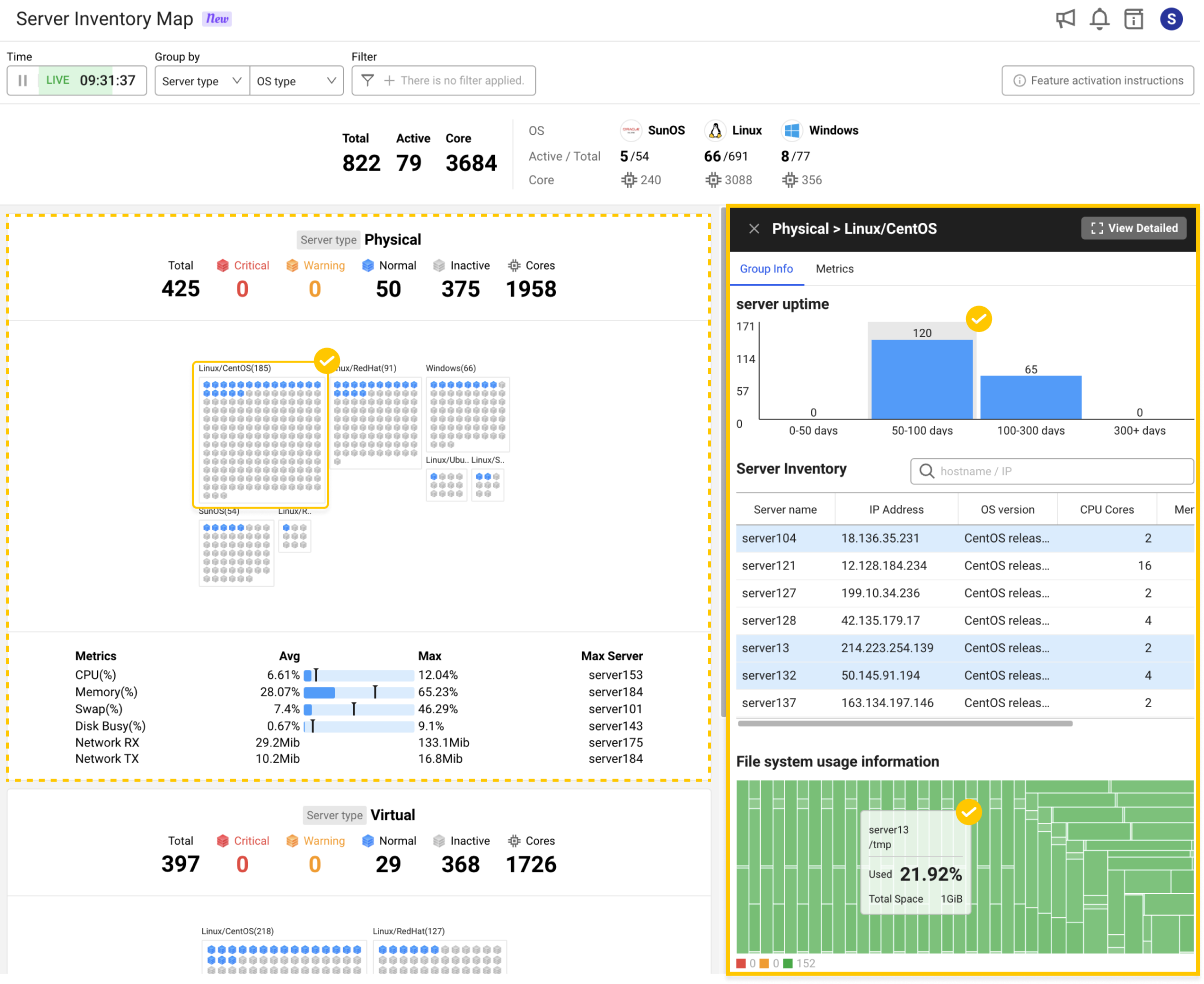
When you select a group in the server inventory map chart, you can see the summary view panel on the right. The summary view panel provides the Group Info and Metrics tabs.

Display Detail
Click Display Detail on the upper right of the summary view panel. For more information about Display Detail, see the following.
Group Info
In the Group Info tab, you can effectively check the main operation status and resources of the selected server group as follows.
Server uptime
It divides the operation period into sections since the server booting and visualizes the number of servers in the section in bar chart format. When a bar chart is selected, the detailed information of servers belonging to the section is highlighted in the Server Inventory list below. If you click the same bar chart, the selection is released.
Server Inventory
You can see key information about the servers in the selected server group in list format. You can filter the data by entering the hostname or IP address in the input fields on the right. It provides server name, IP address, OS version, CPU cores, memory (GB), and server uptime columns.
File system usage information
You can intuitively see the status of the server's file system. Mount points for each server are represented as a block. The block colors indicate the utilization (Used, %) of the mount point. In the same color range, the color intensity increases as the usage rate rises.
-
Red: It indicates that the usage rate is 90% or more.
-
Orange: It indicates that the utilization is 80% or more and less than 90%.
-
Green: It indicates that the utilization is less than 80%.
When you hover the mouse over a mount point block, you can see the server name, mount point, utilization, and total capacity.
Metrics
The Metrics tab allows you to view key server performance metrics in chart format. You can intuitively check the resource status by group.
| Type | Description |
|---|---|
| [CPU] User + Sys (%) | It displays the sum of the utilization in user mode (User) and kernel mode (Sys) out of the total CPU utilization. This displays the overall utilization of CPU resources. |
| [MEM] Used (%) | It displays the rate of memory used by the user processes or kernel. Only pure memory usage is reflected, excluding the buffer and cache areas. |
| [SWAP] Used (%) | This value is the current swap memory size in use expressed in percentage. |
| [NET] Rx (bps) | It displays the amount of data received (Rx) from the network in bits per second (bps). |
| [NET] Tx (bps) | It displays the amount of data transmitted (Tx) over the network in bits per second (bps). |
| [Disk] Read (Bytes) | It displays the sum of the read speeds of the entire disk in bytes per second. |
| [Disk] Write (Bytes) | It displays the sum of write speeds per second of the entire disk in bytes. |