Server details
Home > Select Project > Server List > Server Detail
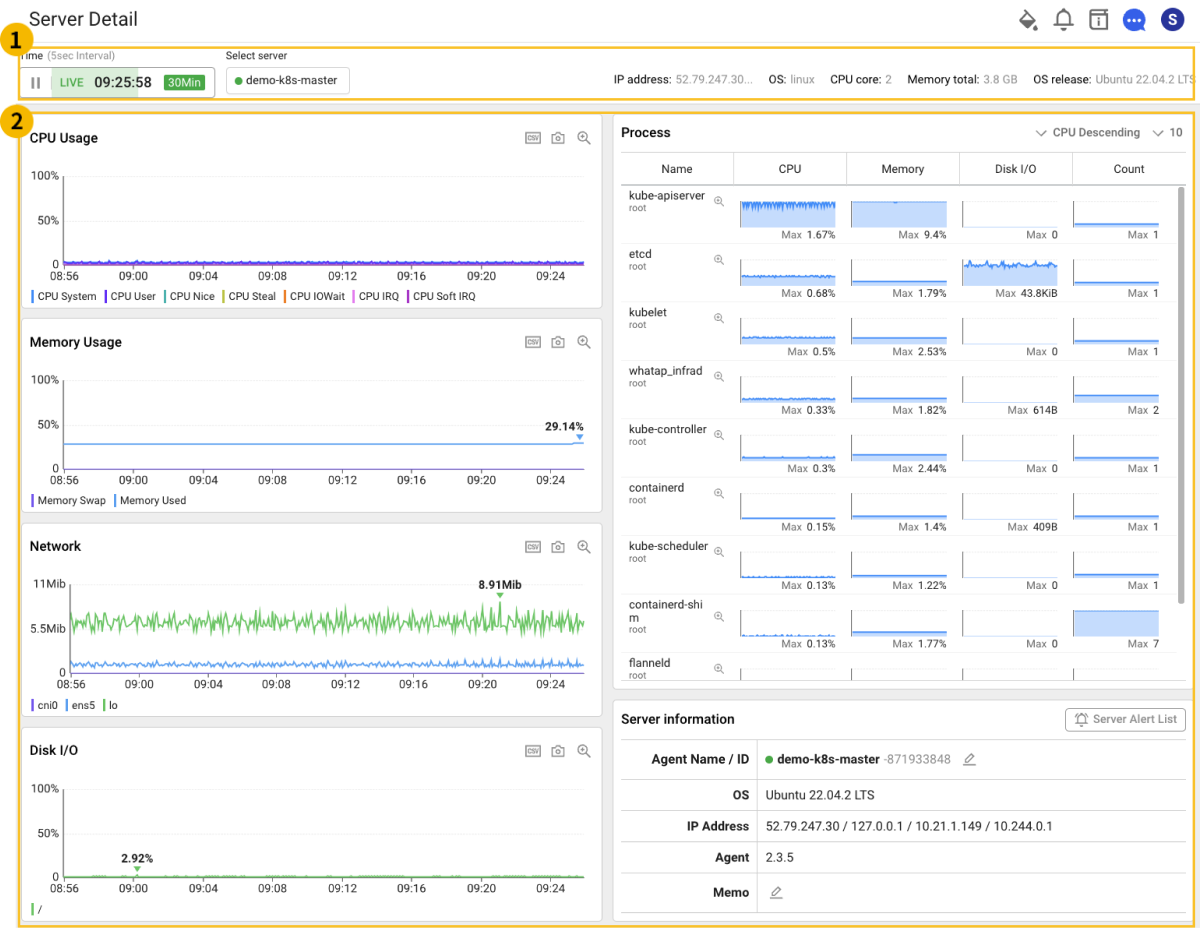
Select a project in the initial screen of the WhaTap monitoring service, and then select Server Detail under Server List. Server Detail provides detailed information on the server resource status and running processes.
 Options at the top
In the ![]() area at the top, you can set the data for data update time and server. You can see the Summary Info of the server, along with the Data Update Time and Server options.
area at the top, you can set the data for data update time and server. You can see the Summary Info of the server, along with the Data Update Time and Server options.
Data update time
The data on the server detail page is automatically updated every 5 seconds.
-
 Pause : You can stop automatic update of the data.
 -
 Playback : You can restart the auto update you have stopped.
 -
 Refresh : You can update the data based on the current time.
Select Server
The Select server option allows you to set the server to view. If you select a server to inquire from the list, you can see the server resources and detailed information of running processes in the ![]() area.
area.
 Detail
Server resources
In the ![]() area, you can see the resources of the server through the CPU Usage, Memory Usage, Network, and Disk I/O charts.
area, you can see the resources of the server through the CPU Usage, Memory Usage, Network, and Disk I/O charts.
-
 : You can save the chart records in a CSV file.
 -
 : The chart data is saved in an image data.
 -
 : You can see the charts for CPU utilization, memory utilization, network, and disk I/O.
-
CPU Utilization
CPU Usage, CPU Idle, CPU Nice, CPU I/O Wait, CPU Steal, CPU IRQ, CPU Soft IRQ, CPU Load
-
Memory utilization
Memory Usage, Memory Available, Memory SReclaimable, Memory SUnreclaim, Memory Slab, Memory Swap Used, Memory Page Faults
-
Network
Traffic in/out. Packet in/out, Error in/out, Dropped in/out
-
Disk I/O
Disk I/O, IOPS read/write, Disk Bph Read/Write, Used space, Queue length, Inode Used, Free space
-
Process List
Align
-
You can search by setting a sorting in descending or ascending order according to the selected metric at the top of Process list.
-
According to the metric selected at the top of Process list, you can check by setting the top 10, 20, 30, and All processes.
Grouping
A process group is a set of multiple processes with the same behaviors in an instance. You can add process groups by selecting the Group by button. For more information about process grouping, see the following.
Server information panel
You can see the following in the Server information panel. In case of *** Agent Name*** and Memo, you can edit only in Server information panel.
-
 Server Alert List
At the top of Server information panel, if you select
Server Alert List, the alerts for the current server appear. -
Agent Name / ID
You can check the agent name (alias for ONAME) and ID (OID) of the selected server. You can modify the agent name by selecting the
 button.Note
ONAME is set to the host name by default.
-
OS
You can see the OS information of the selected server.
-
IP Address
You can see the IP address of the selected server.
-
Agent
You can see the agent version of the selected server.
-
Memo
By checking the written memo or selecting
, you can modify or add any memo.