Resource board
Home > Select Project > Dashboard > Resource Board
On the initial screen of the WhaTap Monitoring service, select a project and then select Dashboard > Resource Board.
Resource Board allows you to monitor all servers registered in a project.
It provides the CPU resource map to check the summary of all servers in the project and changes in real-time resource usage. It displays Top 5 total resource size, CPU, memory, and utilization processes. You can immediately recognize and respond to failures through the Resource Board.
 Fixed menu
 Theme: You can change the theme of the current page. The default value is Light mode.
 Alert Status: It displays recent events. You can turn on or off the browser notifications by clicking the toggle menu.
 Customer Support: Online customer support is available.
- Profile icon: Select the rightmost icon. Manage Accounts, Create organization, Organization Management, and function to select a language are provided.
 Info panel
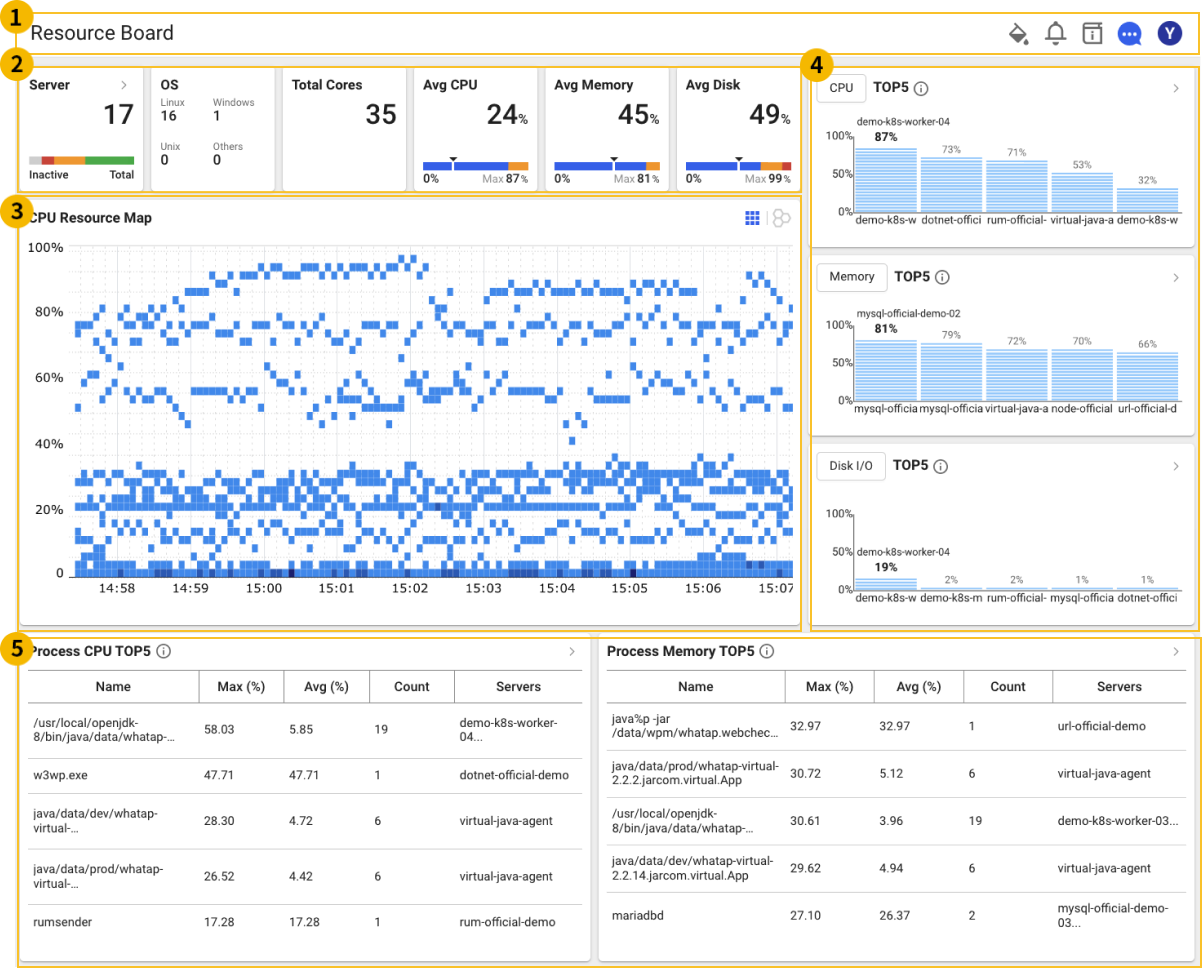
It provides the summary metrics for all servers registered in the project. They are updated every 10 seconds.
-
Server
It provides the total number of servers together with the number of servers with problems. If you select an area, the Server List page appears.
-
Exception status: Danger, Warning
-
Normal Server: Medium, Inactive
-
-
OS
Number of operating systems in the project such as Linux and Windows
-
Total Cores
Sum of cores for all servers.
-
Avg CPU
Average CPU usage (%) for all servers. The gauges below are Average, Maximum, and Minimum.
-
Avg Memory
Average memory usage (%) for all servers. The gauges below are Average, Maximum, and Minimum.
-
Avg Disk
Average disk usage (%) for all servers. The gauges below are Average, Maximum, and Minimum.
 CPU Resource Map
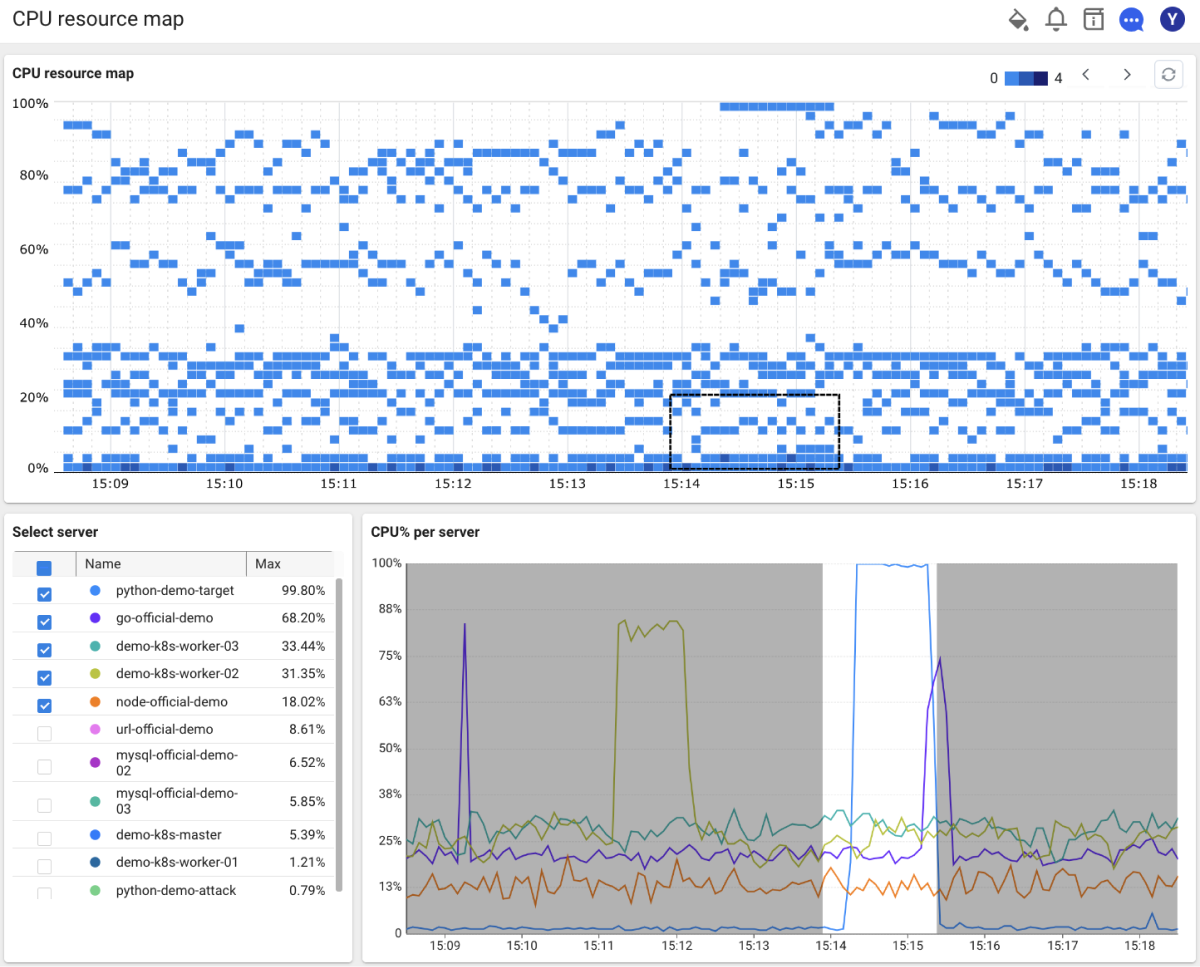
This distribution chart displays the CPU usage of all servers. It displays data for 10 minutes and is updated every 10 seconds. The deepness of the cell color indicates that the server's resource usage is widely distributed in the area.
-
Provision of detailed info
If you drag the cell area, the detailed information is provided.
-
The server list is sorted by the maximum value of the data collected in the range.
-
Five servers are selected by default, and the usage trend of the selected servers are also provided in a multi-line chart.
-
Click
 Refresh to refresh the current data.
-
Multi Line Chart
Multiple lines are displayed on a chart.
 Resource Equalizer
It displays a list of the top 5 servers in real time for CPU, Memory, Disk I/O, and Disk IOPS.
For example, the disk I/O (%) metric displays the disk usage for 5 seconds. If the disk I/O usage (%) exceeds 80%, the system performance can be affected. The default alert value is 90%. If the disk I/O (%) is 100%, it means that the disk is working non-stop.
-
If you select the equalizer chart area, the target Server Detail page appears.
-
If you select
 , the Resource Equalizer page appears. You can see the real-time usage for all servers.
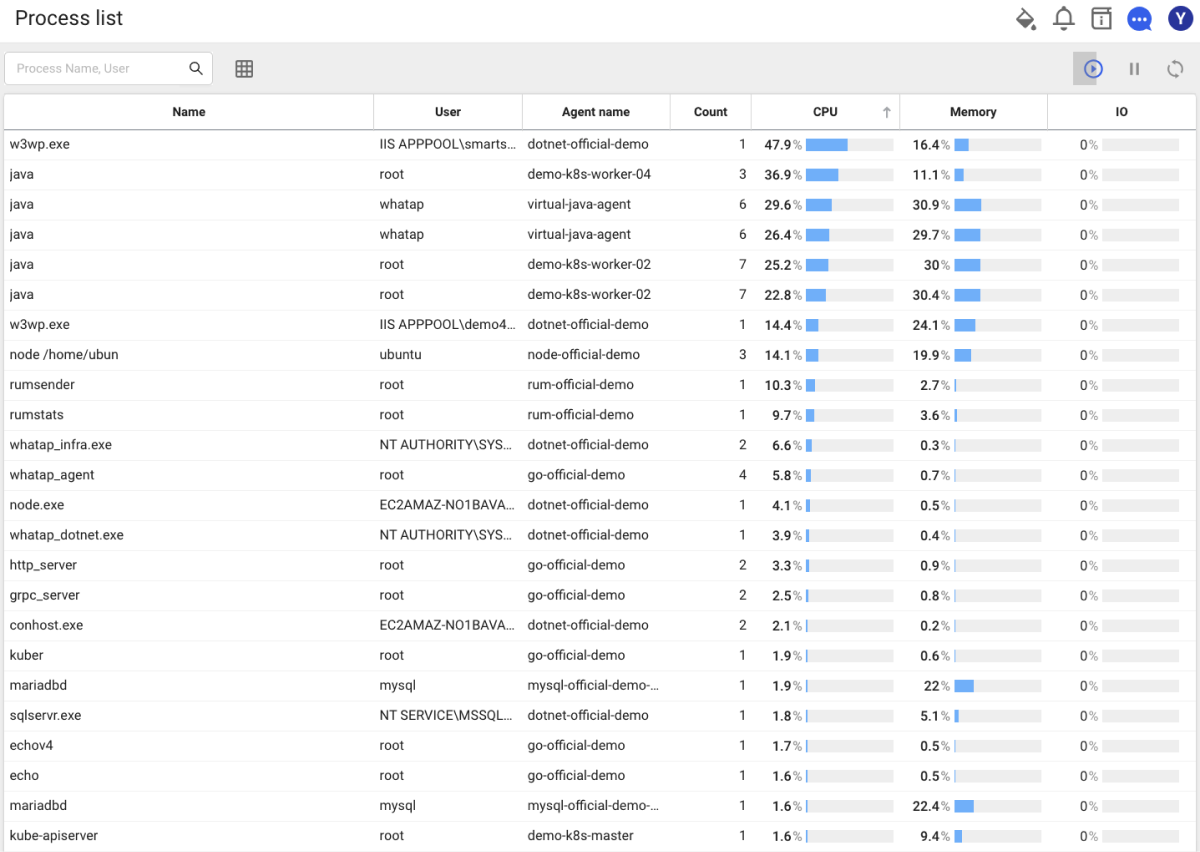
 Process Top 5
The list of top 5 processes is provided based on the maximum occupancy of CPU and memory. If you select ![]() , the Process list for all servers appears.
, the Process list for all servers appears.