Server Report
Home > Select Project > Report
If you click in Report on the screen, you can see various analysis reports classified by daily, weekly, and monthly. Select a desired report format, and then set the date and time to view and filtering options. You can check the selected report by selecting
.
Daily server report
In Daily Server Report, you can see the usage of server resources for the day. You can search by setting the start date, start time, and end time.
Intro

You can see a summary of project names, number of hosts, and number of alerts. For the numbers of hosts and notifications, you can see how much has changed compared to the previous day.
- Number of Hosts: Total number of servers during the query period
- Number of Alerts: Total number of alerts during the query period
Server list
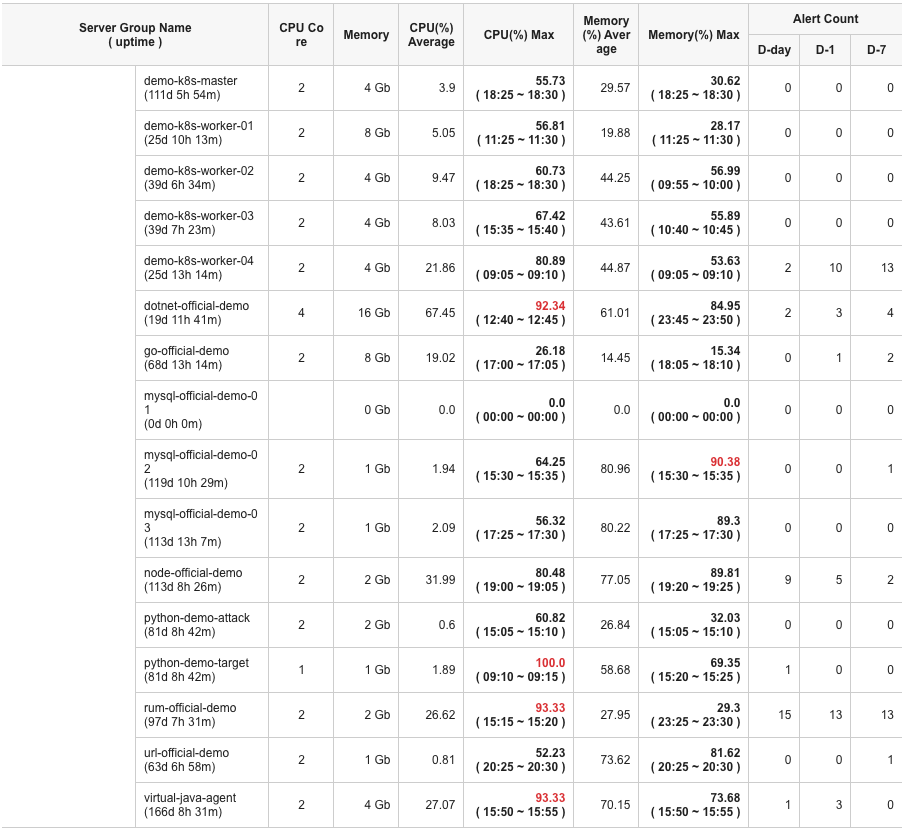
You can check the daily key metrics for each server. In case of the maximum CPU (CPU Max) and maximum memory (MEM Max), the time at which the corresponding figures are displayed appears together.
The numbers of alerts can be compared by retrieving data of 7 days ago, 1 day ago, and the day of inquiry.
Red appears when the average and maximum values for CPU and memory are above 90%.
Alert history
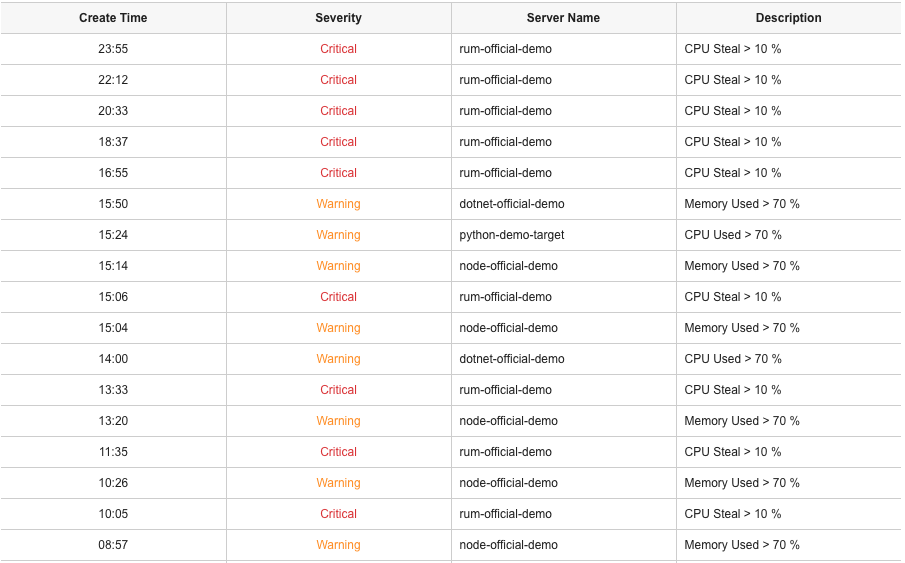
You can check the occurrence time, rating, server name, and cause of the alert in the notification history during the query period. For more information about each alert, see Alert > Event History. If there is no alert record for the project, the message, "No data exists for the period." may appear.
According to the notification level, Critical notifications appear in red, Warning notifications orange, and Info notifications gray.
Weekly server report
In Weekly Server Report, you can see the usage of server CPU and memory for the week. You can enter the start date and see from 7 days prior to the day of inquiry. It searches data for 7 days from the start date.
Full resource usage list
CPU
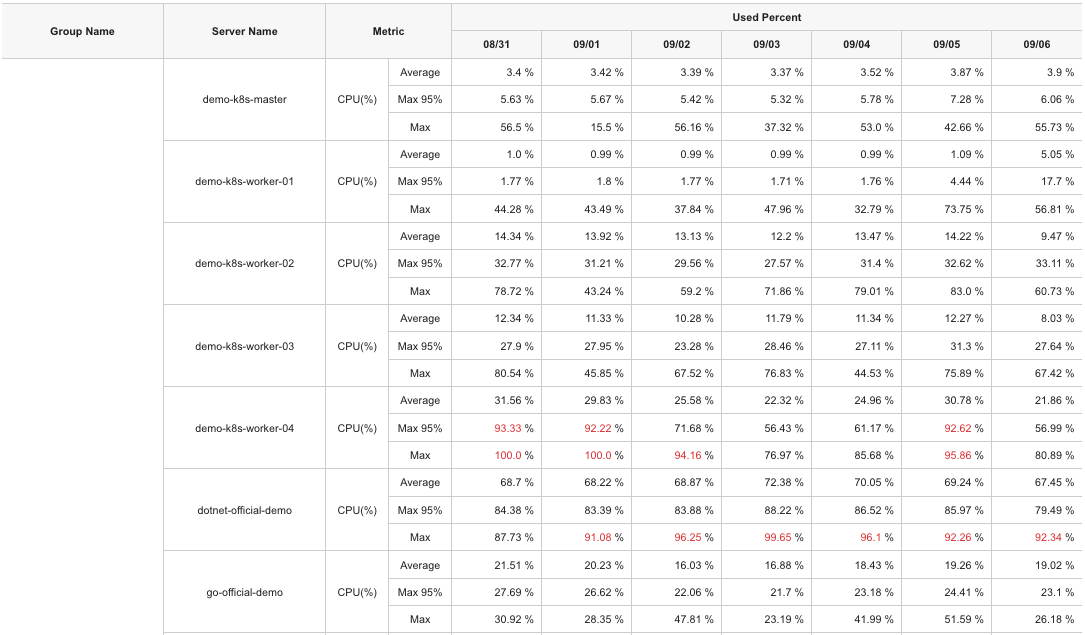
It views the CPU utilization for each server by day during the query period. Queried items are CPU average, 95% of maximum, and maximum. Each value is represented as a percentage.
95% of maximum
It indicates the maximum value excluding the top 5% data. This is used to exclude the momentary high figures due to any reason such as server restart.
Memory
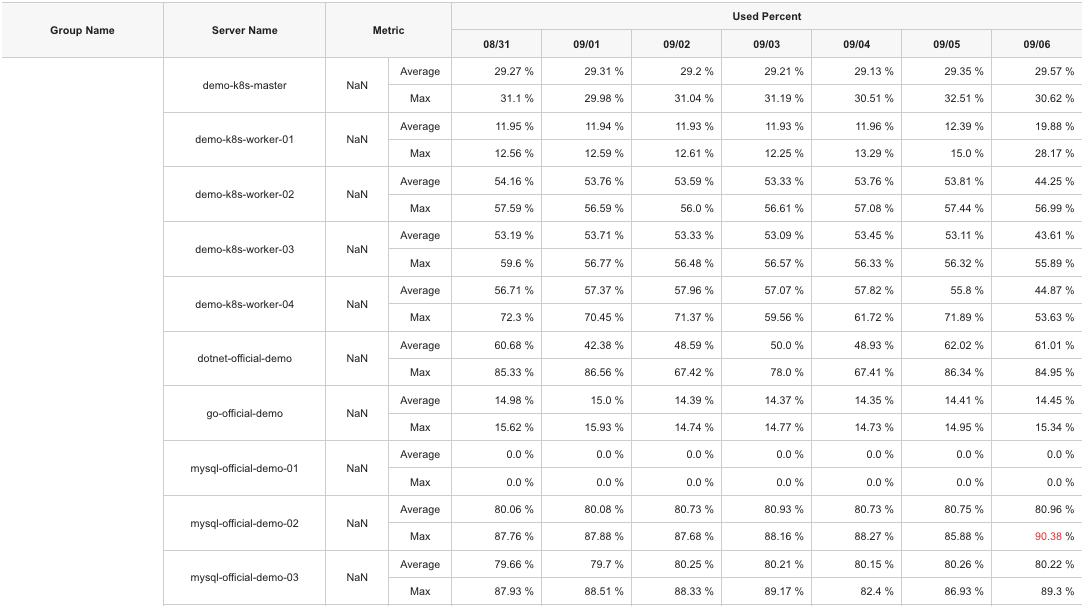
It views the memory usage for each server by day during the query period. Queried items are memory average and maximum value. Each value is represented as a percentage.
Disk
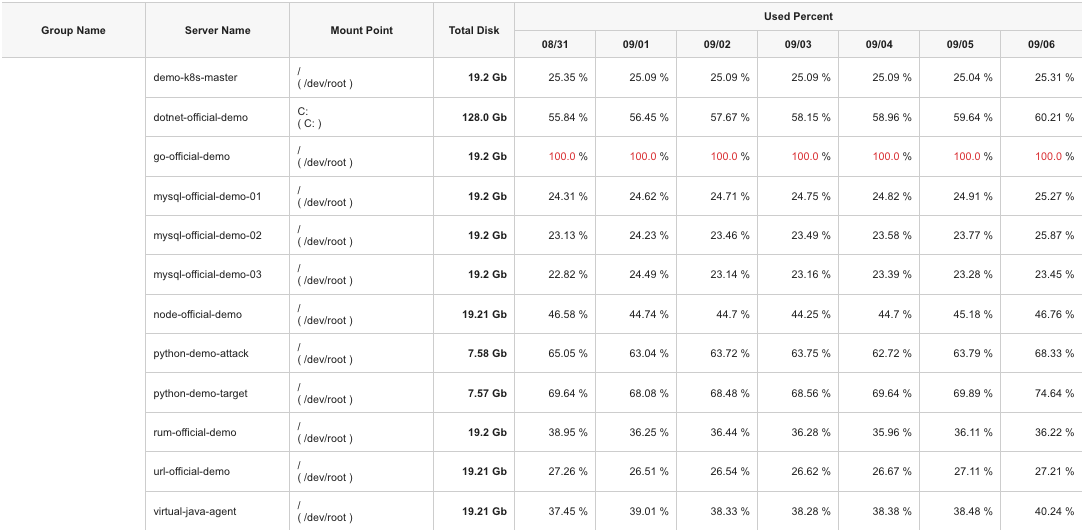
Metrics per file system mounted on each server during the query period. It views the mount location, total disk size, and utilization. Each value is represented as a percentage.
- If the value is 90% or more, it is displayed in red.
okindNameappears in the group name, and may be blank ifokindNameis not set.
Monthly server report
In Monthly Server Report, you can see the usage and data of server resources for the month. You can enter the start date and see from 30 days prior to the day of inquiry.
Intro

You can see the aggregate the usage of server resources for the month.
- Total Host: Total number of servers during the query period
- Total Core: Total number of cores during the query period
- Total Disk: Size of the mounted file systems for the query period
- Alert All: Total number of alerts during the query period
Server information
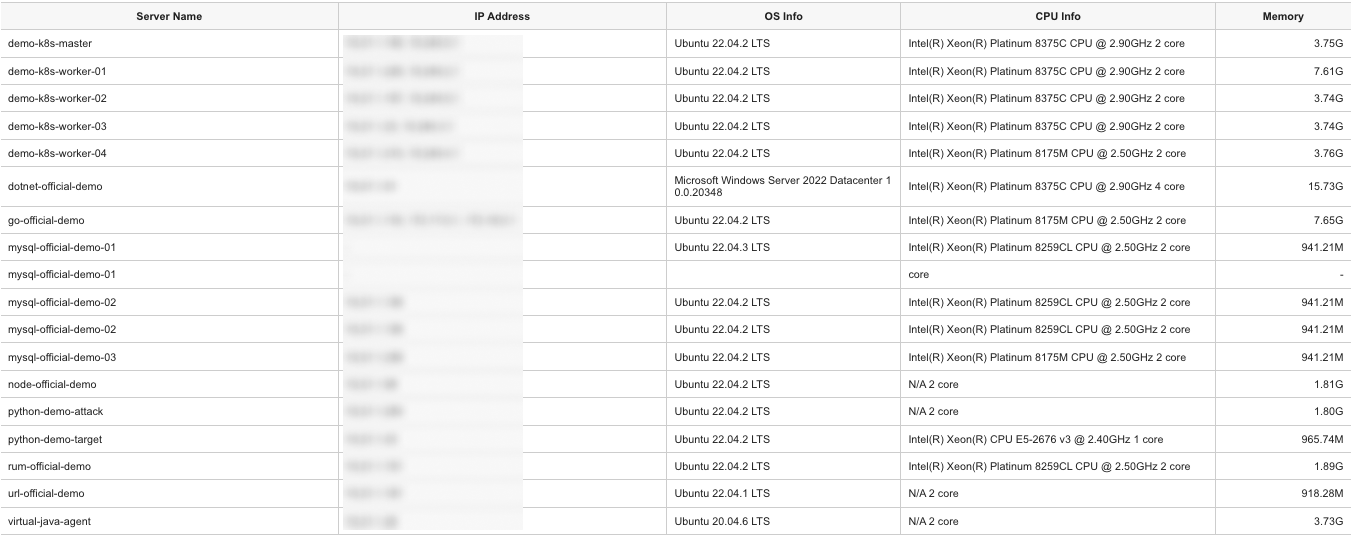
It displays the IP address, OS data, CPU data, and memory usage of the server run during the query period.
Alert details
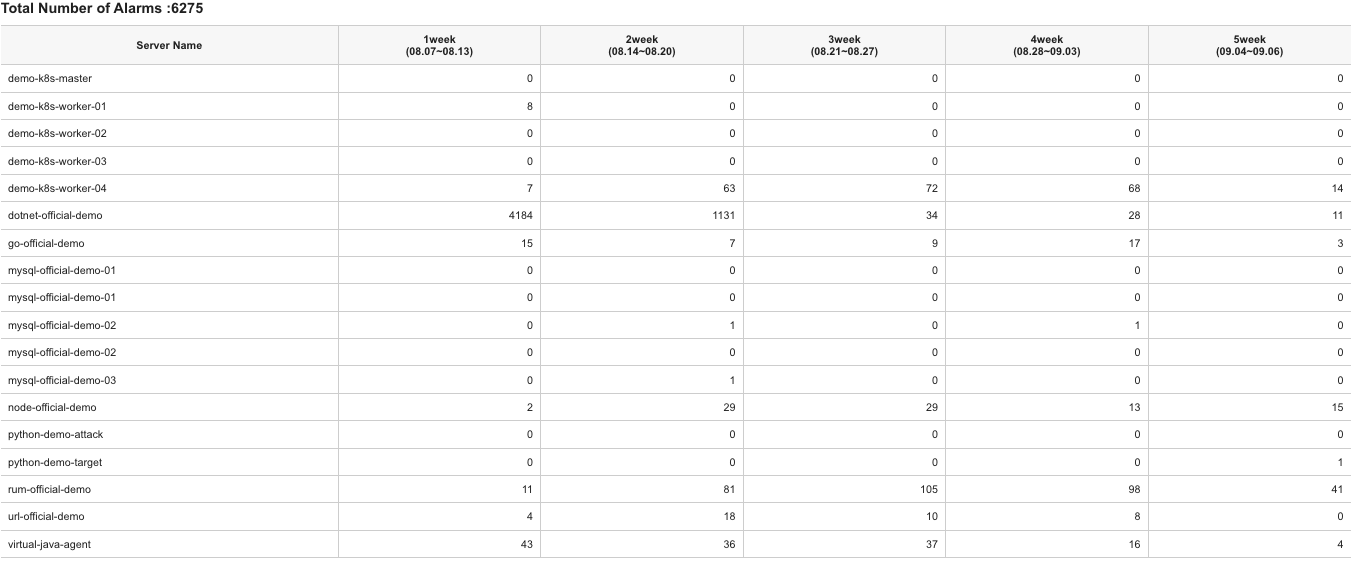
You can check the total number of alerts for all servers during the query period, and you can view the alerts generated by server for each week.
List of servers in use
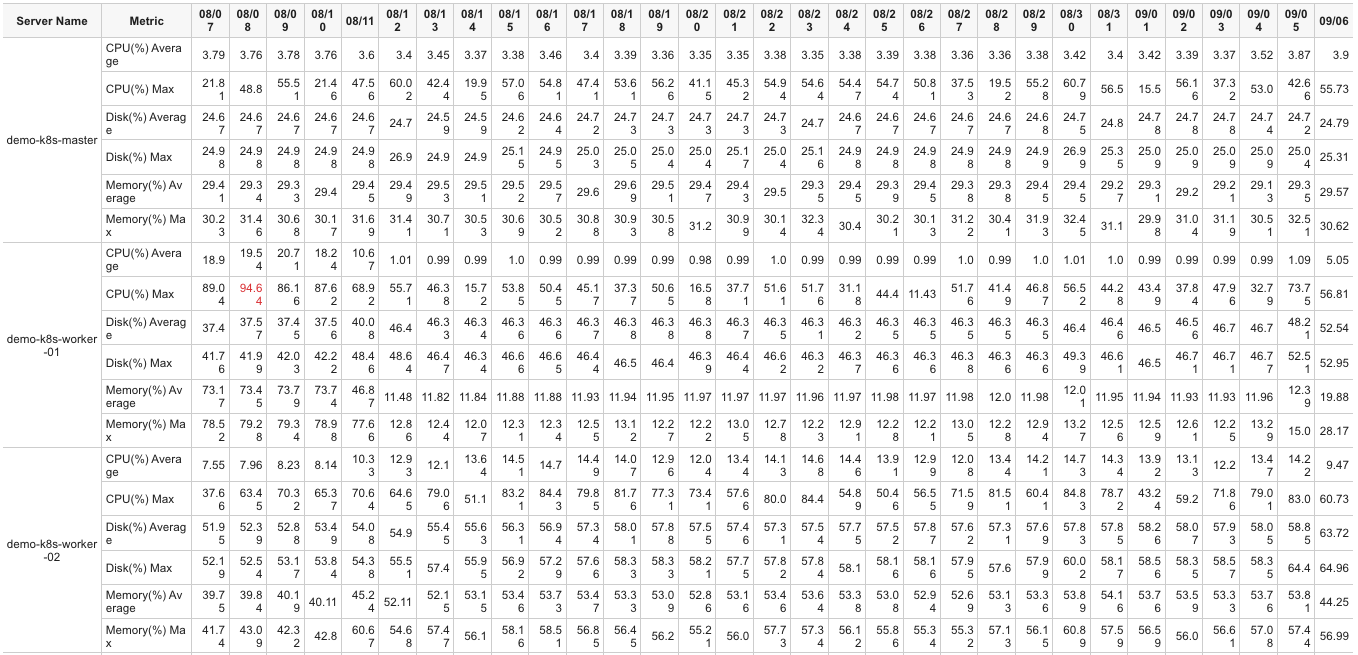
You can check the CPU average usage and its maximum value, and memory average usage and its maximum value for each server at a glance.
If the value is 90% or more, it is displayed in red.