CUBE
Home > Select Project > Analysis > Cube
On the initial screen of the WhaTap Monitoring service, select a project and then select Analysis > Cube.
What is Cube?
We call the performance statistics generated every 5 minutes as Cube. Cube analysis uses each 5-minute performance data stored in cubes.

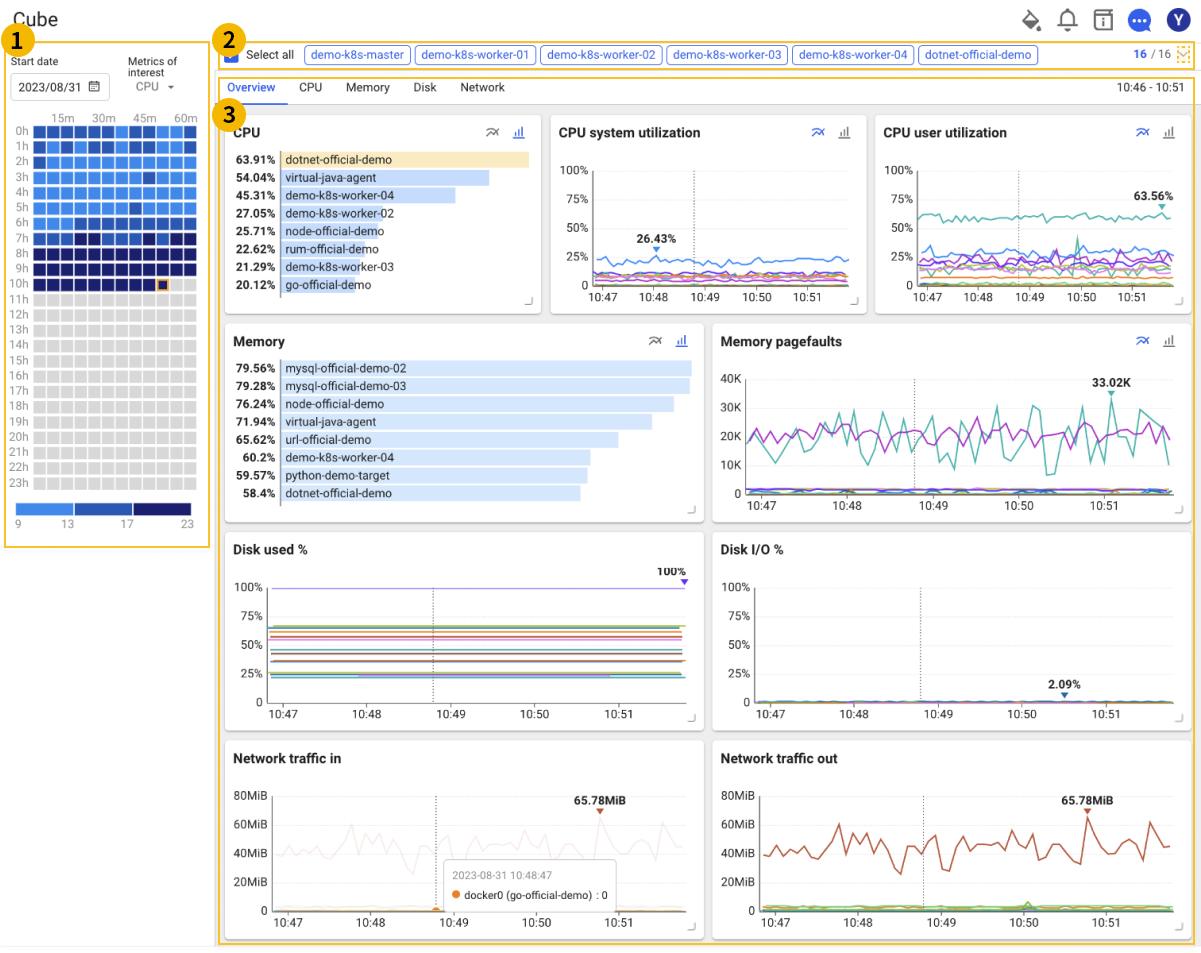
 Cube selection panel
Select a cube based on the specific time in the cube selection panel in the left. Because the cubes are stored every 5 minutes, select a specific time.
-
Panel interest metric
The interest metric in the server cube select panel are CPU and Memory.
-
Cube color
The cubes are displayed in different colors depending on the number of the selected metrics.
-
Dark blue: high figure
-
Light blue: low figure
-
 Application selector
Through the application selector option in the area at the top, you can select data for specific applications. If you select
on the right, all available applications can be selected as follows:

-
Select all: All applications are viewed. By default, Select all and Active application are selected.
-
View only selected: Among the applications, only the specified applications are queried.
-
Search: If there are many applications, you can search for them through the input field.
-
Number/Number: Displays the number of applications specified/number of all applications.
 Cube data
- If you select the
icon on the upper right of the chart, the bar-type chart appears.
- If you select the
icon on the upper right of the chart, line charts are provided.
In the area of , the cube data can be checked through the charts for CPU, Memory, Disk, and Network.
-
CPU
Displays the applications in the project sorted in order of highest CPU usage.
-
Memory
Displays the applications in the project sorted in order of highest memory usage.
-
Disk
Displays the applications in the project sorted in order of highest disk usage.
-
Network
Displays the applications in the project sorted in order of highest network traffic.
WhaTap uses the IP2Location LITE database for IP geolocation.