Compound Eye
Home > Select Project > Dashboard > Compound Eye
On the initial screen of the WhaTap Monitoring service, select a project and then select Dashboard > Compound Eye.
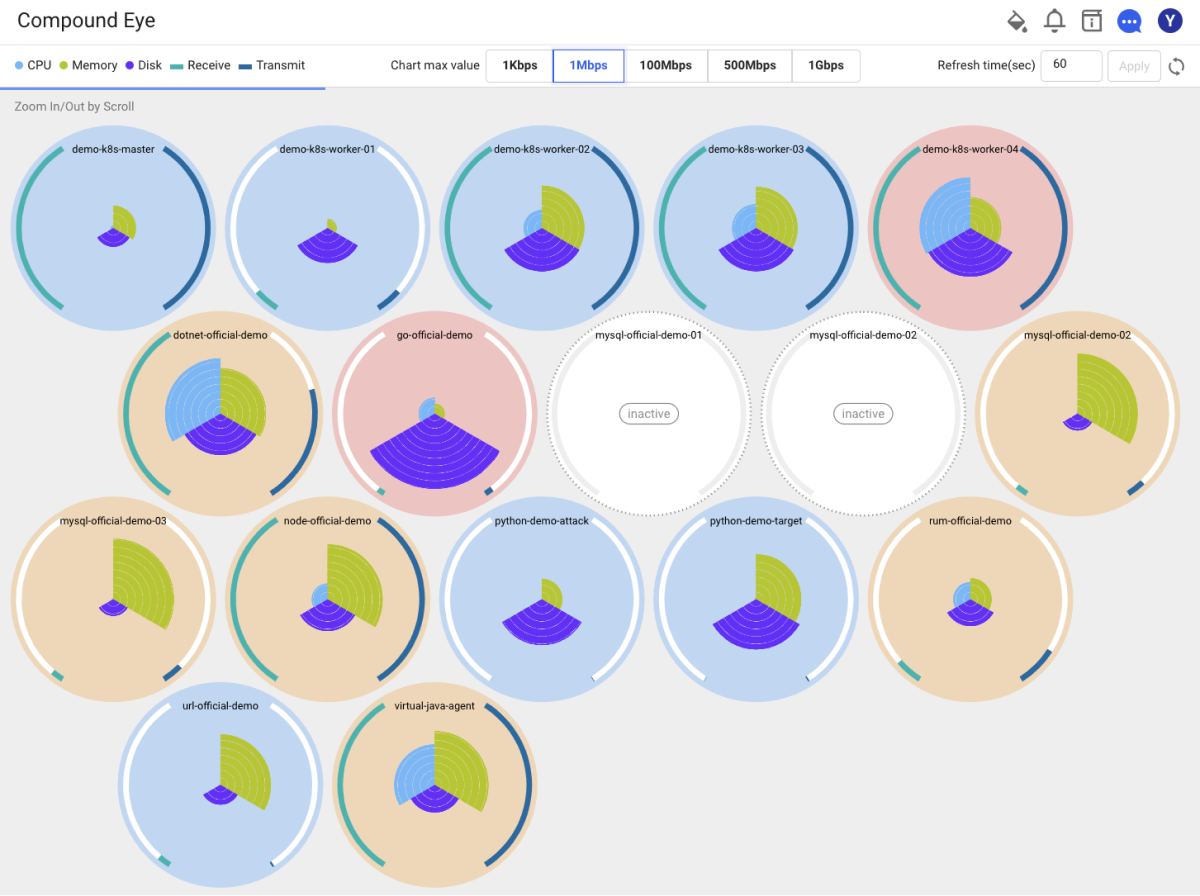
Compound Eye gives you a complete view of all servers where WhaTap agents have been installed. You can check the resource status of large-scale servers at a glance. It provides a visual view rather than sampling or summary for large-scale server resources.
Provided information
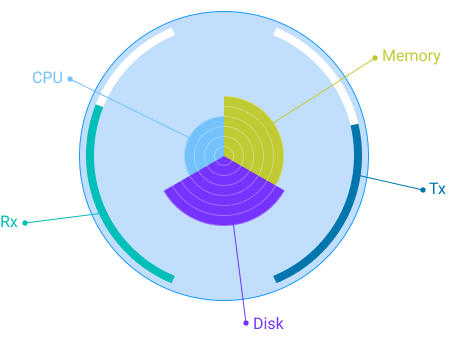
It displays information with an eye. It provides 5 different data.
-
CPU: CPU usage
-
Memory: Memory usage
-
Disk: Disk usage
-
Rx: Network Rx (received amount)
-
Tx: Network Tx (transmitted amount)
Network Rx/Tx You can look at the network Rx/Tx usage metrics to see if external attacks like DDoS are coming from multiple servers at a time.
Anomaly occurrence
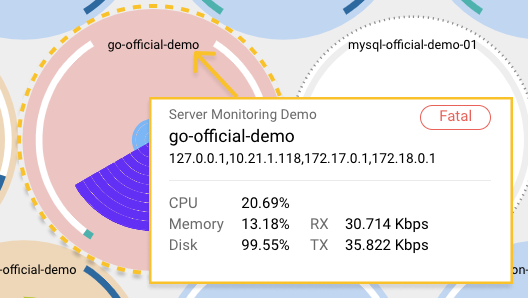
When an anomaly occurs on the server, each Eye expresses the condition with a color.
-
Red: Fatal condition
-
Orange: Alert condition
-
Gray: Monitoring paused
In addition, when the mouse cursor is placed on the server, each individual pop-up message appears with numerical data. If you click on a server, the server's summary page appears for more information.
Traffic Max Value option
Because the amount of traffic may change depending on the network environment, the maximum traffic can be adjusted. If you set the desired maximum traffic value, the Rx/Tx graph changes depending on the value.
