Advanced functions
Expansion pack settings
To use the extension pack function after installation, create the configuration file and then restart the agent as follows.
MySQL instances
The MySQL/MariaDB monitoring agent is available.
Checking the web URL performance
The WhaTap infrastructure agent accesses the given web address and then collects the access status and response time. The collected web URL performance can be checked in Category server_webcheck. Add web addresses to check with the following command. For more information about URL monitoring, see the following.
- Linux Shell
- Windows Powershell
echo "web address to check" | sudo tee -a /usr/whatap/infra/conf/webcheck.conf
echo "webcheck.enabled=true" | sudo tee -a /usr/whatap/infra/conf/whatap.conf
sudo service whatap-infra restart
Add-Content -Path "C:\Program Files\WhatapInfra\webcheck.conf" -Value "web address to check"
Add-Content -Path "C:\Program Files\WhatapInfra\whatap.conf" -Value "webcheck.enabled=true"
Restart-Service "Whatap Infra"
Redis Instances
The WhaTap infrastructure agent accesses the given Redis address and collects multiple performance metrics including the number of connections. The collected performance data can be checked in Category server_redis. You can add the connection data to the Redis server to be checked with the following command.
- Linux Shell
- Windows Powershell
sudo echo "addr=Redis address:port" | sudo tee /usr/whatap/infra/conf/redis.conf
sudo echo "password=Redis password" | sudo tee -a /usr/whatap/infra/conf/redis.conf
sudo service whatap-infra restart
Add-Content -Path "C:\Program Files\WhatapInfra\redis.conf" -Value "addr=Redis address:port"
Add-Content -Path "C:\Program Files\WhatapInfra\redis.conf" -Value "password=Redis password"
Restart-Service "Whatap Infra"
Memcached Server List
The WhaTap infrastructure agent accesses the given Memcached address and collects multiple performance metrics including the number of connections. The collected performance data can be checked in Category server_memcached. You can add the connection data to the Memcached server to be checked with the following command.
- Linux Shell
- Windows Powershell
sudo echo "addr=Memcached address:port" | sudo tee /usr/whatap/infra/conf/memcached.conf
sudo echo "password=Memcached password" | sudo tee -a /usr/whatap/infra/conf/memcached.conf
sudo service whatap-infra restart
Add-Content -Path "C:\Program Files\WhatapInfra\memcached.conf" -Value "addr=Memcached address"
Add-Content -Path "C:\Program Files\WhatapInfra\memcached.conf" -Value "password=Memcached password"
Restart-Service "Whatap Infra"
TCP port monitoring
You can be notified when the network daemon's listening port has been disabled.
Select Home > Select Project > Alert > Event Configuration > Server tab, and then select + Add alert settings.
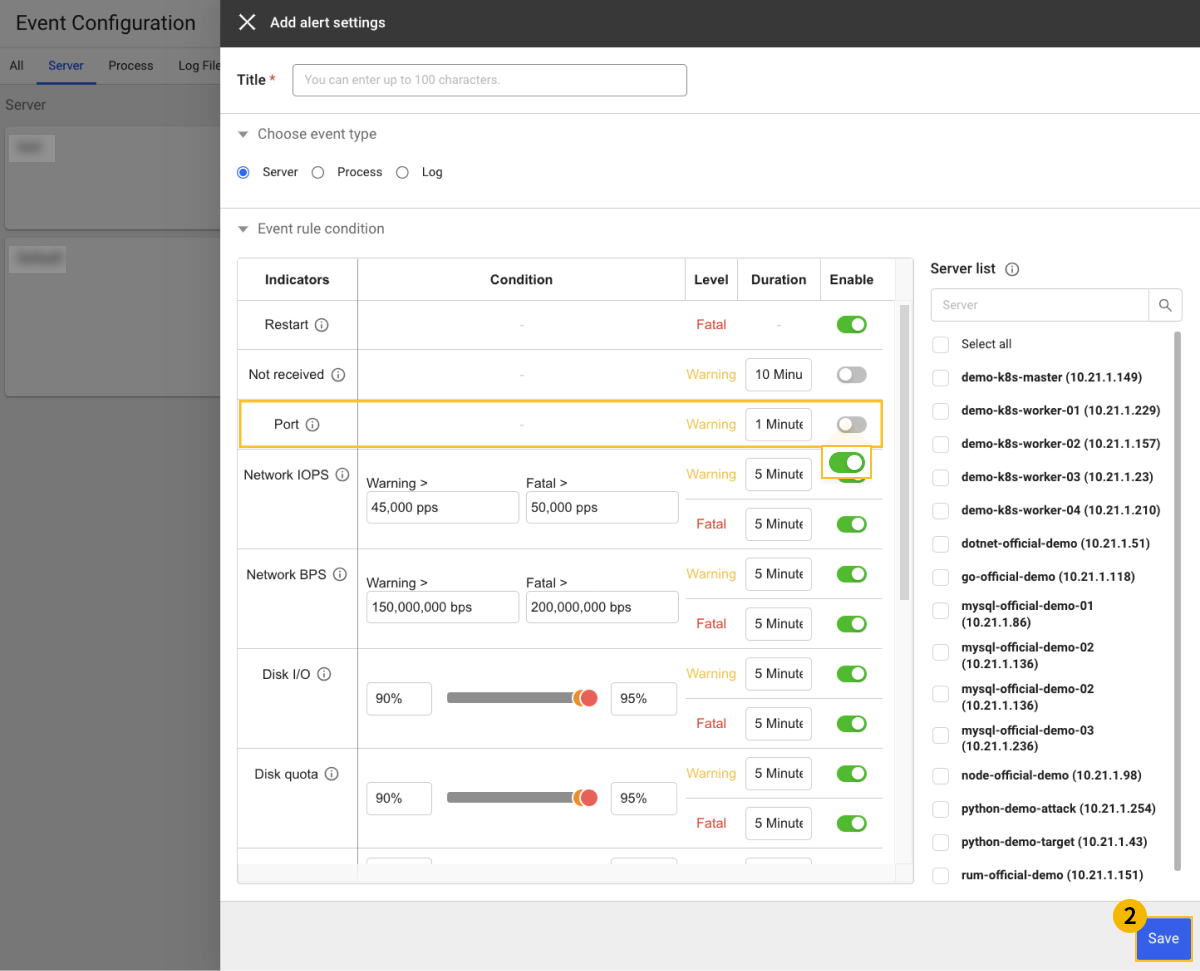
-
Click the
 Port metric toggle button and then change it to Use.
 -
Select
 Save to save the settings.
 -
Add the following command on the target server.
- Linux Shell
- Windows Powershell
#Specify the IP to be monitored in the following variable.
export TARGET_IP=127.0.0.1
#Specify the port to be monitored in the following variable.
export TARGET_PORT=80
echo "tcp.check.$TARGET_PORT=tcp://$TARGET_IP:$TARGET_PORT" |sudo tee -a /usr/whatap/infra/conf/whatap.conf
#Specify the IP to be monitored in the following variable.
$TARGET_IP="127.0.0.1"
#Specify the port to be monitored in the following variable.
$TARGET_PORT="80"
Add-Content -Path "C:\Program Files\WhatapInfra\whatap.conf" -Value "tcp.check.${TARGET_PORT}=tcp://${TARGET_IP}:${TARGET_PORT}"
Multi-port monitoring
To monitor multiple ports, additional configuration is required in the whatap.conf file. See the following example:
# port 8080, port 80
tcp.check.8080=tcp://127.0.0.1:8080
tcp.check.80=tcp://127.0.0.1:80
Process network performance measurement
The process network performance can be checked in the Process widget under Server List > Server Detail.
- Linux Shell
- Windows Powershell
echo "process.fdcheck=true" |sudo tee -a /usr/whatap/infra/conf/whatap.conf
# The admin role is required.
Add-Content -Path "C:\Program Files\WhatapInfra\whatap.conf" -Value "process.fdcheck=true"
Collecting the server specifications
It collects the specifications for CPU, memory, disk, and NIC, installed packages, and meta data of virtual machines. For each Category, you can check the following.
server_package: Installed package.server_inventory: Specifications for CPU, memory, disk, and NIC.server_pending_security_update: Waiting list for Linux security patches.
- Linux Shell
- Windows Powershell
echo "inventory.product.enabled=true" |sudo tee -a /usr/whatap/infra/conf/whatap.conf
# The admin role is required.
Add-Content -Path "C:\Program Files\WhatapInfra\whatap.conf" -Value "inventory.product.enabled=true"
Collecting the Linux container performance
It collects the performance for CPU, memory, disk, and NIC in the Linux containers. The collected performance data can be checked in Category server_container.
echo "container.enabled=true" |sudo tee -a /usr/whatap/infra/conf/whatap.conf
Collecting the Windows server service opertions status
It collects the Windows service operation status. The collected service operation status can be checked in Category server_windows_service.
# The admin role is required.
Add-Content -Path "C:\Program Files\WhatapInfra\whatap.conf" -Value "winservice.enabled=true"
File monitoring
You can monitor the files and directories that exist or can exist on the file system.
- Linux Shell
- Windows Powershell
echo "filecheck.enabled=true" |sudo tee -a /usr/whatap/infra/conf/whatap.conf
echo "Full path of the file or directory to monitor" |sudo tee -a /usr/whatap/infra/conf/filesystem.conf
Add-Content -Path "C:\Program Files\WhatapInfra\whatap.conf" -Value "filecheck.enabled=true"
Add-Content -Path "C:\Program Files\WhatapInfra\filesystem.conf" -Value "Full path of the file or directory to monitor"
Nvidia GPU monitoring
If the nvidia-smi command is embedded, the GPU performance data is collected every 5 seconds to upload to WhaTap. The data is collected to the metrics Category server_nvidiasmi.
- Linux Shell
- Windows Powershell
echo "nvidiasmi.enabled=true" |sudo tee -a /usr/whatap/infra/conf/whatap.conf
Add-Content -Path "C:\Program Files\WhatapInfra\whatap.conf" -Value "nvidiasmi.enabled=true"
-
category server_nvidiasmi
Metrics Remarks DecoderUtil gauge, Decoder utilization (in %) EncoderUtil gauge, Encoder utilization (in %) FreeFbMemoryUsageGpu gauge, Framebuffer memory free (in MiB) UsedFbMemoryUsageGpu gauge, Framebuffer memory used (in MiB) GpuTemp gauge, GPU temperature (in C) GpuUtil gauge, GPU utilization (in %) MemClock gauge, Memory clock frequency (in MHz) MemoryUtil gauge, Memory utilization (in %) SmClock gauge, SM clock frequency (in MHz)
Changing the location of the WhaTap agent logs
Change the path of the WhaTap agent logs (whatap_infrad.log, whatap_infra.log, whatap_infrad.fork.stdout.log). If the specified path does not exist, the WhaTap agent attempts to create the path. It is available in the agent 2.0.6 or later.
- Linux Shell
- Windows Powershell
echo "agent.log.prefix=Desired Directory" |sudo tee -a /usr/whatap/infra/conf/whatap.conf
Add-Content -Path "C:\Program Files\WhatapInfra\whatap.conf" -Value "agent.log.prefix=Directory to change"
In case of Windows, enter "\" as the path delimiter.
Netstat monitoring
If the netstat command is embedded, collection is uploaded to Category server_netstat (netstat connection statistics) and server_netstat_s (result of netstat -s command).
- Linux Shell
- Windows Powershell
echo "netstats.enabled=true" |sudo tee -a /usr/whatap/infra/conf/whatap.conf
Add-Content -Path "C:\Program Files\WhatapInfra\whatap.conf" -Value "netstats.enabled=true"
User script monitoring
- Linux Shell
- Windows Powershell
It periodically runs the executable user script on the Linux server and uploads the results. Write your own script noting the following example
-
Write the script as follows and then run it.
Linux Shell#!/bin/bash
urls=("https://www.whatap.io" "https://blog.whatap.io" "https://service.whatap.io")
for url in ${urls[*]}; do
echo "M $url url $url"
curl -w @- -o /dev/null -s "$url" <<'EOF'
M %{url_effective} url %{url_effective}\n
H %{url_effective} time_namelookup %{time_namelookup}\n
H %{url_effective} time_connect %{time_connect}\n
H %{url_effective} time_appconnect %{time_appconnect}\n
H %{url_effective} time_pretransfer %{time_pretransfer}\n
H %{url_effective} time_redirect %{time_redirect}\n
H %{url_effective} time_starttransfer %{time_starttransfer}\n
H %{url_effective} time_total %{time_total}\n
EOF
done -
Check whether the out is as follows:
Linux Shell$ ./curl.sh
M https://www.whatap.io/ url https://www.whatap.io/
H https://www.whatap.io/ time_namelookup 0.007289
H https://www.whatap.io/ time_connect 0.010702
H https://www.whatap.io/ time_appconnect 0.033637
H https://www.whatap.io/ time_pretransfer 0.033831
H https://www.whatap.io/ time_redirect 0.000000
H https://www.whatap.io/ time_starttransfer 0.043230
H https://www.whatap.io/ time_total 0.043312
M https://blog.whatap.io/ url https://blog.whatap.io/
H https://blog.whatap.io/ time_namelookup 0.000000
H https://blog.whatap.io/ time_connect 0.000000
H https://blog.whatap.io/ time_appconnect 0.000000
H https://blog.whatap.io/ time_pretransfer 0.000000
H https://blog.whatap.io/ time_redirect 0.000000
H https://blog.whatap.io/ time_starttransfer 0.000000
H https://blog.whatap.io/ time_total 0.005654
M https://service.whatap.io/ url https://service.whatap.io/
H https://service.whatap.io/ time_namelookup 0.004296
H https://service.whatap.io/ time_connect 0.007282
H https://service.whatap.io/ time_appconnect 0.038404
H https://service.whatap.io/ time_pretransfer 0.038607
H https://service.whatap.io/ time_redirect 0.000000
H https://service.whatap.io/ time_starttransfer 0.055226
H https://service.whatap.io/ time_total 0.055307 -
Check whether the collection is normal and register the script to the WhaTap server monitoring agent as follows:
Linux Shellexport USER_SCRIPT=Absolute path to the script to run
suco chmod +x $USER_SCRIPT
sudo mkdir /usr/whatap/infra/ext/
sudo cp -r $USER_SCRIPT /usr/whatap/infra/ext/
export RUNAS_USER=Account to run the script. Root account is excluded.
sudo WHATAP_HOME=/usr/whatap/infra/conf /usr/whatap/infra/whatap_infrad --user=$RUNAS_USER init-script
sudo service whatap-infra restart
The collected data can be viewed in Category 'server_ext_folder_runscript' under Analysis > Metrics Chart.
It periodically runs the executable user script on the Windows server and uploads the results. Write your own script noting the following example
- BAT
- PowerShell
Running the BAT script
-
Write the script as follows and then run it.
BAT@echo off
setlocal enabledelayedexpansion
set urls=https://www.whatap.io https://blog.whatap.io https://service.whatap.io
for %%u in (%urls%) do (
echo M %%u url %%u
rem Use curl to fetch the URL and get the total time taken for the request
for /f "tokens=*" %%i in ('curl -o nul -s -w "M %%{url_effective} url %%{url_effective}" %%u') do (
echo %%i
)
rem Measure the start time
set startTime=!time!
rem Perform the curl request and measure the end time
curl -o nul -s %%u
set endTime=!time!
rem Parse the start time
for /F "tokens=1-4 delims=:.," %%a in ("!startTime!") do (
set /A "startH=%%a, startM=%%b, startS=%%c, startMS=%%d"
)
rem Parse the end time
for /F "tokens=1-4 delims=:.," %%a in ("!endTime!") do (
set /A "endH=%%a, endM=%%b, endS=%%c, endMS=%%d"
)
rem Calculate the elapsed time in milliseconds
set /A "elapsedMS=(endH*3600000 + endM*60000 + endS*1000 + endMS) - (startH*3600000 + startM*60000 + startS*1000 + startMS)"
rem Convert milliseconds to seconds and milliseconds part
set /A "elapsedSec=elapsedMS/1000"
set /A "elapsedMSPart=elapsedMS %% 1000"
echo H %%u time_total !elapsedSec!.!elapsedMSPart!
)
endlocal -
Check whether the out is as follows:
BAT>webcheck.bat
M https://www.whatap.io url https://www.whatap.io
M https://www.whatap.io/ url https://www.whatap.io/
H https://www.whatap.io time_total 0.38
M https://blog.whatap.io url https://blog.whatap.io
M https://blog.whatap.io/ url https://blog.whatap.io/
H https://blog.whatap.io time_total 0.1
M https://service.whatap.io url https://service.whatap.io
M https://service.whatap.io/ url https://service.whatap.io/
H https://service.whatap.io time_total 0.922 -
Check whether the collection is normal and register the script to the WhaTap server monitoring agent as follows:
BATcd "\Program Files\WhatapInfra"
whtap_infra.exe init-script
sc stop "Whatap Infra"
sc start "Whatap Infra"
Running the PowerShell script
-
Write the script as follows and then run it.
PowerShell$urls = @("https://www.whatap.io", "https://blog.whatap.io", "https://service.whatap.io")
# Hide progress bar
$ProgressPreference = 'SilentlyContinue'
foreach ($url in $urls) {
Write-Output "M $url url $url"
$startTime = Get-Date
try {
$response = Invoke-WebRequest -Uri $url -UseBasicParsing
$endTime = Get-Date
$timeTotal = ($endTime - $startTime).TotalSeconds
Write-Output "M $($response.BaseResponse.ResponseUri) url $($response.BaseResponse.ResponseUri)"
Write-Output ("H {0} time_total {1}" -f $url, $timeTotal)
} catch {
Write-Output "Failed to access $url"
}
} -
Check whether the out is as follows:
PowerShell> .\webcheck.ps1
M https://www.whatap.io url https://www.whatap.io
M url
H https://www.whatap.io time_total 0.376979
M https://blog.whatap.io url https://blog.whatap.io
Failed to access https://blog.whatap.io
M https://service.whatap.io url https://service.whatap.io
Failed to access https://service.whatap.io -
Check whether the collection is normal and register the script to the WhaTap server monitoring agent as follows:
PowerShellcd "\Program Files\WhatapInfra"
.\whatap_infra.exe init-script
Restart-Service "Whatap Infra"
Server time synchronization monitoring
Preliminary checking
-
Operating system: Linux
-
WhaTap Server Monitoring Agent version: 2.5.4 or later
You can enable the server time synchronization (NTP) monitoring through the following option:
echo "ntpq.enabled=true" |sudo tee -a /usr/whatap/infra/conf/whatap.conf
Guide to additional key metrics
The metrics to be added when activating the server time synchronization monitoring are as follows:
server_ntpq
Tags
| Tag name | Description | Remarks |
|---|---|---|
refid | Time synchronization source of the corresponding remote (remote). | - |
remote | Server to which the host performs time synchronization. | - |
Fields
| Field name | Unit | Description | Remarks |
|---|---|---|---|
delay | ms | Time taken for the server to return a reply packet in response to a query. | - |
jitter | - | Error threshold estimated as the difference in offset measurements between two samples. | - |
offset | ms | Difference between the server setting time and client setting time. | - |
poll | second | Polling interval to the remote host defined by the minpoll value in the ntp.conf file. | - |
reach | - | You can see how successful the attempts to reach the server were. It records the success or failure of the most recent query at the position 2^0 and operates as an 8-bit shift register. | - |
st | - | Stratum level of the remote host. | - |
sync_client | - | 1: The synchronization server exists. | - |
| 0: The synchronization server does not exist. | |||
t | - | Available types are as follows. | - |
| l: Local (e.g. GPS clock) | |||
| u: Unicast (general type) | |||
| m: Multicast | |||
| b: Broadcast | |||
when | second | Seconds elapsed after the remote host responded. | - |
Linux system log monitoring
By uploading the Linux system logs in real time, you can check the logs generated upon failure. The log files to collect are as follows:
- /var/log/syslog
- /var/log/messages
The configuration is as follows:
echo "systemlog.enabled=true" |sudo tee -a /usr/whatap/infra/conf/whatap.conf
Log monitoring plug-in
You can arbitrarily collect the logs. The following configuration requires restart of the agent.
Linux Shell
cd /usr/whatap/infra
sudo mkdir extension

cat <<EOL | sudo tee extension/logsink.conf > /dev/null
[[inputs.logsink]]
  category = "serverlog"
  ## Whether or not to send the data with separate log generation statistics
  stats_enabled = true
  ## Category for log generation statistics
  stats_category = "logsink_stats"
  ## Set the log non-target file names to be excluded with asterisk (*) in the log file path
  excludeNames = [ ".gz",".zip" ]
  [[inputs.logsink.file]]
    ## When setting a log file, you can set the date pattern (strftime.org).
    path = "/some/path/%Y-%m-%d/.log"
    disabled = false
    encoding = "utf-8"

  [[inputs.logsink.file]]
    path = "/some/other/log"
    disabled = false
    encoding = "utf-8"

  [[inputs.logsink.file]]
    ## When searching for the keyword in the line-by-line log, merge it with the previous log.
    nowrap_keywords = ["Caused by:", "Test"]
EOL

sudo service whatap-infra restart
Windows Powershell
# Require an Administarotr role
New-Item -type "Directory" -Path "C:\Program Files\WhatapInfra\extension"

$contentToAdd = @"
[[inputs.logsink]]
category = "serverlog"
## Whether or not to send the data with separate log generation statistics
stats_enabled = true
## Category for log generation statistics
stats_category = "logsink_stats"
## Set the log non-target file names to be excluded with asterisk (*) in the log file path
excludeNames = [ ".gz",".zip" ]
[[inputs.logsink.file]]
## When setting a log file, you can set the date pattern (strftime.org).
path = "c:\\whatap\\logs%Y-%m-%d_.log"
disabled = false
encoding = "utf-8"
[[inputs.logsink.file]]
## When searching for the keyword in the line-by-line log, merge it with the previous log.
nowrap_keywords = ["Caused by:", "Test"]
"@

New-Item -path "C:\Program Files\WhatapInfra\extension" -name "logsink.conf" -type "file" -value $contentToAdd -Force

Restart-Service "Whatap Infra"
Configuring options
-
stats_enabled: Set whether or not to collect the collection status data. The default value isfalse. The value must be set totrue. If set totrue, statistical data is generated in the category (logsink_stats) set in the followingstats_category. -
stats_category: Set the metrics category to store the collection status data in. The value must be set tologsink_stats. Statistical data fields are as follows:filecheckIntervalencodingfileposcheckedLocalTimelastupdatedLocalTimefileSizeerrorfirstChecktransferBytes
-
excludeNames: By including asterisks (*) in the log file path, you can set the file name to exclude non log files. You can set multiple values using comma (,) as the delimiter.ExampleexcludeNames = [ ".gz",".zip" ] -
nowrap_keywords: While searching logs by line, if any keyword is detected by a specified option value, it is merged with the previous log.
Configuring the log options for Windows events
When collecting Windows event logs, you can set the options as follows:
# Require an Administarotr role
New-Item -type "Directory" -Path "C:\Program Files\WhatapInfra\extension"

$contentToAdd = @"
[[inputs.win_eventlog]]
    category = "win_event_log"
    stats_category = "win_event_log_stats"
    stats_enabled = true
    enabled = true
    [[inputs.win_eventlog.file]]
        #true | false
        enabled = true
				# Application, Security, Setup, System, Forwarded
				file = "Application"
				#1: Information, 2: Warning 3: Critical 4: Audit Success 5 Audit Fail
				#event_type =
				#event id
				#event_id =
				#event source name
				#source_name = ""

"@

New-Item -path "C:\Program Files\WhatapInfra\extension" -name "win_eventlog.conf" -type "file" -value $contentToAdd -Force

Restart-Service "Whatap Infra"
-
Support version 2.5.2
-
OS: Windows
-
It is required to specify the
category.e.g.
win_event_log -
It is required to specify the statistics category (
stats_category).e.g.
win_event_log_stats -
The statistics category On/Off (
stats_enabled) is required.e.g.
trueorfalse -
The collection On/Off (
enabled) is required.e.g.
trueorfalse -
The file-based collection On/Off (
enabled) is required.e.g.
trueorfalse -
The file (
file) is required.e.g.
Application,Security,Setup,System,Forwarded -
The event type (
event_type) is optional.e.g.
1,2,3,4,5NoteEvent type
-
Information
-
Warning
-
Critical
-
Audit Success
-
Audit Fail
-
-
The event ID (
event_id) is optional. -
The event source name (
source_name) is optional.
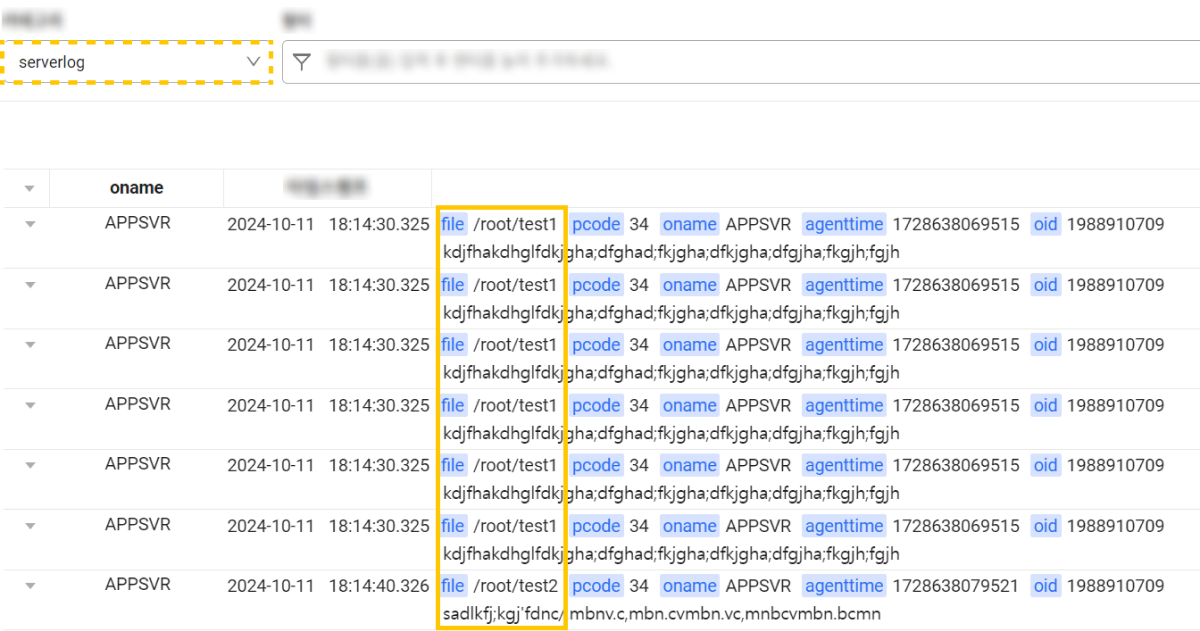
Specifying and separating multiple log files
Specifying multiple files
To categorize multiple log files under the same category, add each log file path into the [[inputs.logsink.file]] entry and specify the file path by using the path setting. Additionally, you can configure additional settings, such as log generation statistics and options such as category, stats_enabled, and stats_category. The example is where the /root/test1 and /root/test2 files are assigned the same category (serverlog).
[[inputs.logsink]]
  category = "serverlog"
  stats_enabled = true
  stats_category = "logsink_stats"
  excludeNames = [ ".gz",".zip" ]

[[inputs.logsink.file]]
  path = "/root/test1"
  disabled = false
  encoding = "utf-8"

[[inputs.logsink.file]]
  path = "/root/test2"
  disabled = false
  encoding = "utf-8"
For information about options such as category, stats_enabled, stats_category, and nowrap_keywords, see the guidance above.
In this example, you can see the following in Live Tail.
File separation
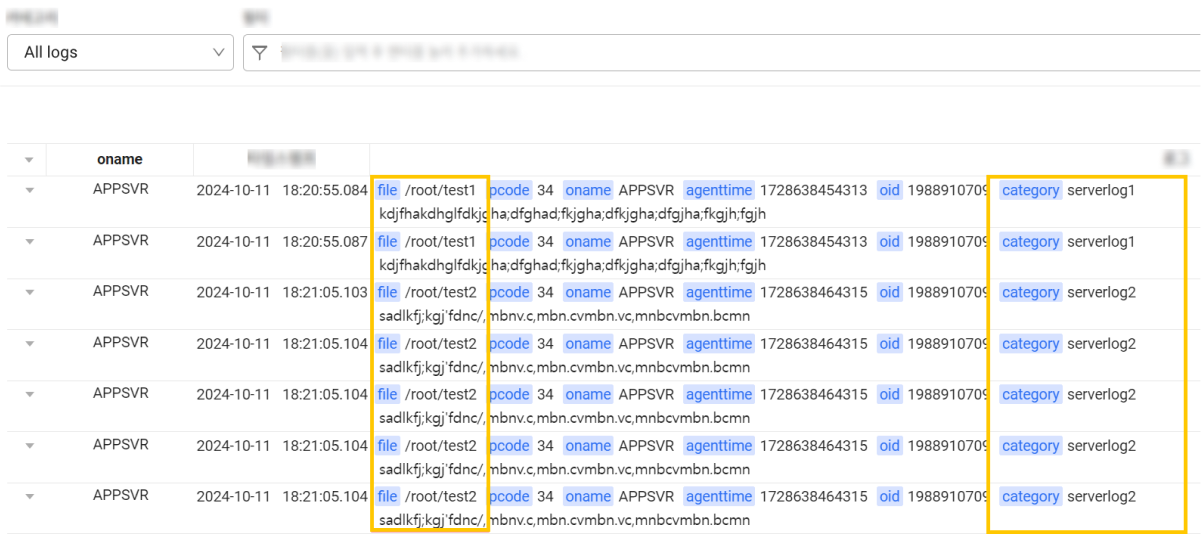
To specify different categories for log files, create separate logsink{number}.conf files and then set different category values in each file. The following example shows how to set different log categories through logsink.conf and logsink1.conf.
# cat logsink.conf
[[inputs.logsink]]
  category = "serverlog1"
  stats_enabled = true
  stats_category = "logsink_stats"
  excludeNames = [ ".gz",".zip" ]

[[inputs.logsink.file]]
  path = "/root/test1"
  disabled = false
  encoding = "utf-8"
#cat logsink1.conf
[[inputs.logsink]]
  category = "serverlog2"
  stats_enabled = true
  stats_category = "logsink_stats"
  excludeNames = [ ".gz",".zip" ]

[[inputs.logsink.file]]
  path = "/root/test2"
  disabled = false
  encoding = "utf-8"
For information about options such as category, stats_enabled, stats_category, and nowrap_keywords, see the guidance above.
In this example, you can see the following in Live Tail.