Service 2.8.X
Service 2.8.5
September 12, 2024
Kubernetes
Fixed In Alert > Event Configuration, fixed typo in the Unassignable node notification template provided when adding a metric event.
Service 2.8.4
September 3, 2024
Common
Fixed In Alert > Notifications, fixed the issue where if you register Teams Workflow as a 3rd party plugin, it is set to Teams.
Service 2.8.3
August 30, 2024
Service 2.8.2
August 29, 2024
Database
Common
Fixed In Management > Agent Installation, the following changes have been applied.
-
Removed the ZIP file download command.
-
Modified the TAR file downloading command.
-
Fixed the issue where the ZIP Download button does not work for the products other than PostgreSQL, Oracle Pro, Altibase, and MySQL.
Oracle Pro
Changed In Analysis > Lock Tree, changed the maximum time range for selecting a cluster to view Global Lock information to 3 hours.
Service 2.8.1
August 28, 2024
Service 2.8.0
August 28, 2024
Release of new features
It provides a guide to the new features released in Service 2.8.0.
Common
New Added Analysis > Metrics Chart New
-
User experience (UX) has been improved so that users can set the time, target, and interval options, and then specify the metrics to monitor and add charts.
-
You can change the time range of a chart view without deleting the widgets placed on the dashboard.
-
It provides a batch update feature that allows you to apply options to all widgets placed on the dashboard at once.
-
The preset feature allows you to save and load the widgets placed on the dashboard.
-
You can adjust the layout of the dashboard and the functionality of the widgets through various options provided.
-
This feature applies to Application, Kubernetes, and Database products.
-
For more information about Metrics Chart
New, see the following.
Application
-
NewAdded the log monitoring feature in the Node.js product.NoteFor more information on how to enable the log monitoring in the Node.js application monitoring environment, see the following.
-
NewAdded the IP Transaction menu to view URLs and the number of calls for specific IPs.Note-
This feature can be seen in the Statistics > IP Transaction path.
-
For more information about IP Transaction, see the following.
-
Database
New Altibase V2 services now launched!
For more information about new features in Altibase Monitoring V2, see the following.
Common
Dashboard
Changed Removed the label display for individual graphs from the vertical equalizer bar chart.
Integrated Flex Board / Flex Board
-
FeatureAdded theORoption between the conditions within the metrics type filters. -
FeatureAdded the font color selection option for rich text widgets. -
FixedFixed the issue where the Edit button appears on the widgets whose titles cannot be modified. -
FixedIn the Widget templates list, fixed the issue where the expand/collapse icon does not change when there is no widget list to display under the product category. -
FixedFixed the issue where the description of the metric is displayed as the widget title when widgets are added using All metrics. -
FixedIn the Rich text widget, fixed the issue where the unsaved content is retained when opening and closing the Edit screen. -
FixedOn the Edit screen of the Rich text widget, set the theme for the tooltip element so that the text and the tooltip of the toolbar button do not overlap. -
FixedFixed the issue where the dashboard filters are not applied in the sub widgetof the group when applying the filters if there is no filter selected in the group widget in Integrated Flex Board.
Analysis
Fixed In Metrics Anomaly Detection, fixed to prevent multiple items from being selected for a category when applying the Filter option.
Alert
-
FeatureIn Notifications, added the third-party plugin to receive alert notifications via Teams Workflows because the Office 365 connector method has been deprecated.NoteFor more information about addition of third-party Teams Workflows plugin, see the following.
-
FeatureIn Notifications, added a third-party plugin to receive alert notifications via PagerDuty.NoteFor more information about addition of third-party PagerDuty plugin, see the following.
-
FeatureIn Event ConfigurationNew, added the feature to perform search with Event name or Event reception tag. -
ChangedChanged the Hide browser notifications feature for notification messages displayed in real time to the Close All Notifications feature that can close all notifications.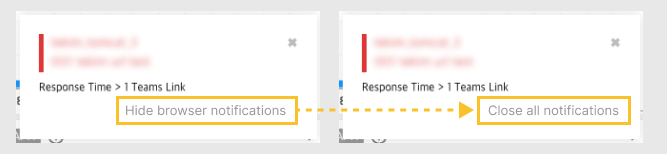
-
ChangedThe term Event Resolution related to warning notification messages to another term in Korean version. -
FixedFixed the issure where the setting is not saved when the same set value is entered if only one of Warning and Critical metrics is activated in the event addition or modification screen of Event ConfigurationV2. -
FixedFixed the issue where the MXQL data is not viewed on the composite metrics addition or modification screen of Event ConfigurationWe fixed the issue where the MXQL data is not viewed when changed to the text mode after setting the tags or fields with the string values by using the Filter option in the Query event data section.
-
FixedIn Event Configuration , modified the event list to be sorted by the event name. -
FixedIn Metrics and Anomaly detection of the Event Configuration menu, fixed the issue where the copy button in the tooltip that appears when hovering over an individual event title does not work. -
FixedIn Alert status, fixed the issue where the number of notifications on the chart is accumulated.
Management
-
FeatureAdded the feature to download the member list as a CSV file from the following menu paths: -
ChangedIn Management > Agent Installation, removed the caution regarding the access key. -
ChangedChanged the location and UI of the Integrated Group Management button. -
FixedFixed the Japanese notation of the product introduction displayed when creating a new project. -
FixedIn Project List on the Home screen, for the project added into the group, modified to display the > Delete From Group menu.
User Interface
-
ChangedChanged some colors for themes. -
FixedFixed the issue where the bottom area is hidden when accessing the WhaTap service screen through the browser on a mobile device. -
FixedIn the side menu, fixed the scroll error of theOrganization list depending on the web browser screen size. -
FixedFixed the issue where themes applied to some text elements are missing. -
FixedAdded left margin for the organization name without logo in the side menu. -
FixedFixed the issue where changing languages with an organization selected does not work intermittently.
Application
-
FeatureIn the Table view tab of the Trace analysis window, added the feature to download SQL statements mapped to bind variables.NoteFor more information about the SQL statement downloading, see the following.
-
ChangedIn Statistics > Error, modified to view the initial data with the Errors only filter active, when you go to the Analysis > Transaction Search menu through the Detailed analysis feature. -
ChangedAdded filter values to pass when navigating to the Transaction Search menu from the sub menus under Statistics.-
Statistics > Domain: Domain, Transaction
-
Statistics > Referrer: Referer, Transaction
-
Statistics > User-Agent: User Agent
-
-
ChangedChanged the filtering selection box in the Trace analysis pop-up window to the group format button.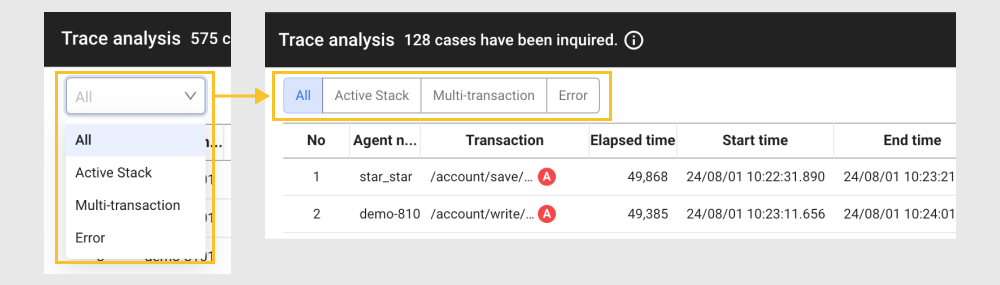
-
ChangedIf the user language is set to English, changed the font size to improve the readability of the Apdex widget guide modal in Dashboard > Application Dashboard. -
ChangedIn Dashboard > Application Dashboard, changed the widget name of Active Transaction Equalizer to Active Transaction, and modified to display the widget name on one line without line breaking. -
ChangedOn the Trace analysis window, changed the default column order. -
FixedIn Dashboard > Application Dashboard, fixed the issue where data for some series charts do not appear intermittently when retrieving the past data. -
FixedModified the substituted variable#in the SQL statement for transactions not to be displayed as$. -
FixedWhen the Instance Performance Management > Opened Socket Count menu changes to the Transaction Statistics menu, fixed the issue where the end time is set earlier than the start time. -
FixedIn the Transaction log tab of the Trace analysis window, modified to output a guidance message when there is no log data.NoteYou can see the corresponding message if the log-related agent options are not set or there is no log data.
-
FixedIn the Firefox browsers, fixed the issue where the center text alignment of the Arc Equalizer widget in the Dashboard > Application Dashboard menu is broken. -
FixedFixed the issue where several stacks are not displayed when a snapshot is saved through the button in Analysis > Stack if the screen theme is in dark mode.
 -
FixedIn the Tree view tab of the Trace analysis window, fixed the issue where the code box boundaries in SQL and Active Stack are displayed as double lines.
Server
-
ChangedIn Process list, changed the Name column data to the name that can be identified in Server Detail or shell. -
FixedWhen adding or modifying events in Alert > Event Configuration, changed the Event rule condition's my font to the default font. -
FixedIn Server CONF. > Runtime ENV. Variable or EVN. Variable, fixed the issue where the menu name of the top of the screen is changed to Agent Log Viewer, if you select the agent list expansion button.
 -
FixedChanged the download link included in the Debian and Ubuntu operating system installation guides in the Management > Agent Installation menu from http to https. -
FixedIn Alert > Event History, fixed the issue where the before and after the alert spacing selection option is displayed as text instead of a button when viewing the event details.
Kubernetes
-
FeatureIn the summary view of Dashboard > Container Map, added the Pod summary analysis feature.NoteThis feature is available in Korean only.
-
FeatureIn View Detailed of the Workload > Pod List menu, added the Pod summary analysis feature.NoteThis feature is available in Korean only.
-
FeatureIn the Target information tab of the Dashboard > Container Map menu, added the Service List navigation link and the feature to see the service object manifest information. -
FeatureIn the node list of the Cluster > Node Disk List menu, added the FileSystem column. -
FeatureIn the Pod list of the Workload > Pod List menu, added the columns for number of containers and number of applications. -
ChangedIn Workload > Container Application List, moved the ApplicationName, ApplicationId column to under the Application information column. -
ChangedIn Management > Namespace Management, added specific guidance messages when creating a namespace project.
Database
Common
-
FeatureAdded the feature to log user actions when the Session kill feature succeeds or fails. -
FeatureIn Dashboard > Monitoring Multiple Instances, added a custom widget that allows you to select metrics.NoteThe custom widget addition feature is available in the
V2environment of the following products: -
FeatureIn Management > Agent Installation, added the feature to download the agent file in ZIP format. -
ChangedModified not to invite the dbx@whatap.io account together when using the Invite the WhaTap support team feature in Management > Project Member.
Altibase
Changed Improved the calling of active session data.
PostgreSQL
Feature Added the Vacuum Sessions widget that can check the number of vacuum processes running in Dashboard > Monitoring Multiple Instances.
MySQL
Fixed In Analysis > Dead Lock, fixed the issue where the message displayed when there is no data retrieved, is half displayed.
Oracle Pro
Feature In Analysis > Lock Tree, added the feature to display global locks when selecting a cluster.
In Lock Tree, for more information on how to check the global lock information, see the following.
Oracle V2, Oracle Pro
-
FeatureAdded the FILTER_PREDICATES column in the Runtime Plan and Explain Plan tables of the SQL details pop-up window. -
ChangedIn Dashboard > Monitoring Multiple Instances, modified to view the data in the Main Waits widget in theactive_sessioncategory. -
FixedFixed the issue where the OBJECT_NAME column link is not enabled when you enter the SQL details pop-up window from Stat/Report > SQL Statistics. -
FixedIn Stat/Report > SQL Statistics, fixed the issue where the elapse time value in the detailed chart is abnormally high. -
FixedModified to display the cluster name in Dashboard > Instance List.
Redis V1, MongoDB V1
Fixed Modified not to display the cluster name in Dashboard > Instance List.
Cloud
Fixed Fixed the issue where the agent installation is not made due to the indentation by the script in the Management > Agent Installation menu for the Amazon ECS platform.
Browser
-
ChangedImproved the UI of the Dashboard > Browser Error > Error message Table section. -
ChangedImproved the UI of the Dashboard > Browser Error > Error message Table > Error Detail > Errors per page section. -
FixedIn User session analysis > User session flow, fixed the problem with the sorting for elapsed times.
Network
Changed If the user language is English, modified the Version to Kernel Version in the Precautions before installation section of Management > Agent Installation.
Log
-
ChangedIn Log > Log Configuration > Getting started with log monitoring, modified not to display the items with#among Data retention per category. -
ChangedIn Log, changed the following options:-
Modified to select at least one column in Column settings.
-
Changed the Table content setting option name to Log view detail setting.
-
In Log view detail setting, changed the Log selection option name to content.
-
In Log view detail setting, modified to select at least one entry.
-
In Column settings, modified not to select Log view detail setting and display the guidance tooltip when the log column is deselected.
-