Service 2.6.X
Service 2.6.4
June 28, 2024
Application
Fixed Fixed the issue where several stacks are not displayed when a snapshot is saved through the  button in Analysis > Stack if the screen theme is in dark mode.
Service 2.6.3
June 27, 2024
Application
Fixed In the following paths, fixed the issue where data is not displayed.
- Trace analysis > Multi transaction > Table
- Analysis > Multiple Transaction Trace > Table
Service 2.6.2
June 27, 2024
Database
Fixed Fixed the issue where the default value in Instance is changed to All in the Database tab of Alert > Event Configuration.
Service 2.6.1
June 26, 2024
Service 2.6.0
June 26, 2024
Common
Flex Board / Integrated Flex Board
-
FeatureAdded the feature to display Selected projects in the widget: you can check the list of projects to call data in the widget. -
FixedFixed the issue where the last character occasionally disappears when text is modified in the rich text widget. -
FixedFixed the issue where the widget deletion pop-up is not reopened if it is closed abnormally. -
FixedFixed the issue where an incorrect alert pops up when a widget is added under a group widget when the responsive dashboard is full.
Analysis
Changed Changed the criteria for the detailed view and display in Metrics Anomaly Detection.
-
Previous: Displays the chart for the dragged period.
-
Change: Displays the data for up to 6 hours.
Alert
Fixed In Event Configuration, corrected the incorrectly set High sensitive/Low sensitive scores for rising/falling patterns with anomaly detection figures.
Usage
-
FeatureReorganized the UI/UX for payment method registration and modification menus (Profile icon > Usage > Payment Information).NoteFor more information about the payment information registration and modification, see the following.
-
ChangedIn Project Subscription Status, modified to display the Subscribe button with separated from the Status column.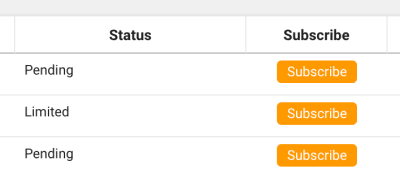
ETC
-
ChangedIn Integrated Dashboard, Integrated Metrics Dashboard, changed the service termination message. -
ChangedImproved the guidance message when there are no search results on the product selection screen for project creation. -
FixedFixed the issue where the selected organization is cleared when going to the product introduction link in the side menu.
Application
Dashboard
-
FeatureIn Application Dashboard, added the default preset modification feature.NoteFor more information about the default preset modification, see the following.
-
FeatureIn Application Dashboard, added the agent search feature.NoteFor more information about the agent search, see the following.
-
FeatureIn Transaction Map, added the Custom feature that can add items in the TOP 30 filter after searching them.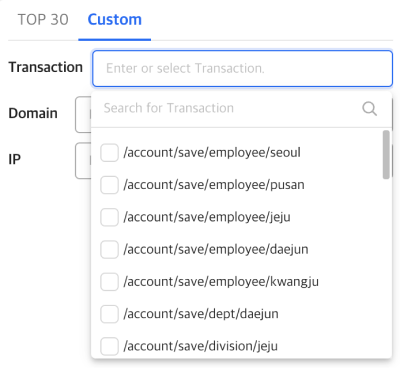 Note
NoteFor more information about the Custom feature, see the following.
-
ChangedThe Application Dashboard menu of old version is scheduled to be removed.-
Added the
Deprecatedtag in the Sitemap menu. -
If you enter Sitemap > Application Dashboard
Old, the guidance message for planned removal appears.
-
-
FixedIn Application Dashboard, fixed the issue where the loading indicator is applied to the widget when the guidance window appears by clicking the button of the widget.
 -
FixedOn the Trace analysis window, fixed the issue where the strings for OS, Client name, and Status are exposed as translation keys. -
FixedFixed the issue where if you select the step timeline graph on the Trace analysis window, the corresponding step does not appear.
Topology
-
FixedIn APP. Topology, fixed the issue where the style of the diagram displayed on the right is not applied properly when the Node Selection button on the screen is selected. -
FixedIn Sitemap > Topology > APP. Statistics Topology, fixed the issue where the feature does not work by clicking the time selection option and changed the UIs for the time selection option.
Statistics
-
FeatureEnhanced the features under Statistics.-
It saves the selected value by the last viewed agent selection option.
-
It changed the feature not to automatically search upon entry of each menu.
-
It changed the initial query period for each menu from Today to Previous day.
-
It changed the default sorting order for Transaction and SQL menus to Sum time.
-
-
ChangedEven if you do not select after applying the filter in the Statistics submenu, the filter is to be applied when you download the CSV file.
 -
FixedFixed the issue where a whiteout occurs when all columns are selected using the Column Settings feature in the following menu paths:
- Statistics > Transaction
- Statistics > User-Agent
Analysis
-
FixedUpon entry to Performance Trend, fixed the issue where only several agents are selected instead of all agents intermittently. -
FixedFixed the issue where the search time for the screen that appears by selecting Detail after dragging the chart on the widget in Metrics Chart.
Java
Fixed Modified the Jetty installation guide in the Add JVM Option section of Management > Agent Installation: JAVA_OPTS → JAVA_OPTIONS.
ETC
-
ChangedIn Instance Performance Management > Loaded Classes, changed the title of the class search window (Class signature → Class details). -
FixedFixed the issue where scrolling is not applied when the agent list in the agent selection (Application) option is greater than the vertical size of the screen.
Server
-
FeatureIn Management > Agent Installation, added the guide page for Oracle Solaris OS installation. -
FixedIn Server List > Server Detail, fixed the issue where the chart legend text moves out of the position when the browser window is reduced in size.
Kubernetes
Container Map
-
FeatureAdded the Containter State and description in the Target information tab of the Summary view. -
ChangedModified the style to expose the link to go to another list menu in the Target information tab of the Summary view. -
ChangedIn the summary view, changed the category sorting sequence in the Log > Search Log tab.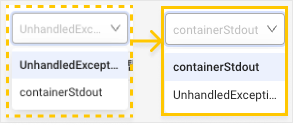
-
ChangedImproved the blinking phenomenon in the Trace and Metrics tabs of Display Detail. -
ChangedModified to expose the Move button to another list menu at the top of Display Detail upon selection of a group. -
FixedIn the summary view, fixed the issue where the search result of the Log > Search Log tab is not consistent with the search result of View Detailed. -
FixedFixed the issue where blocks are not displayed with the correct number in the Container view. -
FixedFixed the bug caused by reengineering.-
If the selected block disappears, the 'Container/Pod does not exist.' message appears in title on the summary view panel.
-
Changed to close summary view panel when Reset option is selected.
-
Fixed the bug where the Trace and Metrics tabs of the detailed view panel display data for all rather than a group after selecting a group.
-
Cluster
-
FeatureIn Node List, added capacityType as a subcolumn of Node info.NoteThis feature is applied only to cluster projects.
-
ChangedThe Container table in Node Detail was modified to match the table in Container > Container List. -
ChangedIn Node Detail, displayed the sums for the following metrics for each container within the node at the top of the Container table.cpu_quota,cpu_request,cpu_total_milli,mem_limit,mem_request,mem_working_set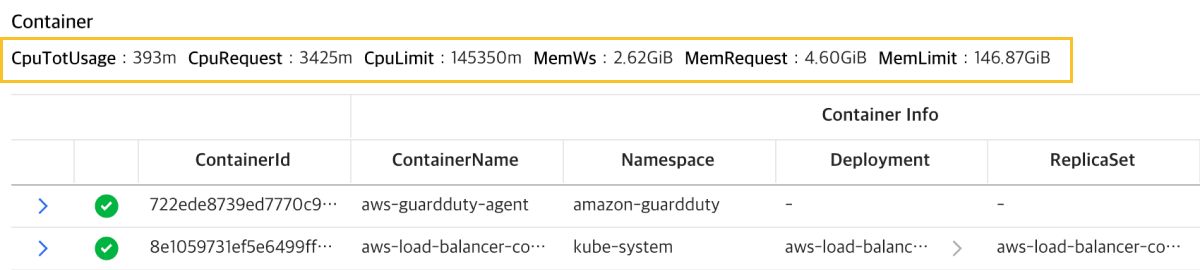
-
ChangedChanged the terminology of the list-type menus as follows:-
Memory → Memory
-
Network → Network
-
Disk → Disk
NoteThere is no change when the language setting is English.
-
-
FixedIn Node List, fixed the issue where the checkbox cannot be selected if the checkbox in the column selection dropdown is overlapped with that in the list below.
Workload
-
FeatureAdded the Pending Pod Status menu to quickly identify Pods in pending status (menu path change from Laboratory > Pending Pods to Workload).NoteThis function is supported in Kubernetes master agent 1.7.0 or later.
-
ChangedIn Container List, changed the column classification. -
ChangedChanged the name of the Oname column in the Container Application List menu to ApplicationName.
Management
-
ChangedIn Agent Installation, added the descriptions on the Java agent configuration options. -
ChangedIn Agent Installation > Additional installation of application monitoring, modifies the PHP agent download command. -
ChangedIn Agent Installation > Additional installation of application monitoring, modifies the Go agent download command. -
FixedIn Correlated project list of the Correlated Project Management menu, modified not to display the linked projects without View role in the list. -
FixedIn Kubernetes Agent List, modified to enable the View Detailed button only when the agent is active.
 -
DeprecatedIn Agent CONF., removed the Previous version button.
ETC
Changed In the following menu path, changed the CPU time column to Thread CPU time, displaying comma (,) as the delimiter for every thousand.
- APP. > Instance Performance Management > Thread List/Dump
- Management > Kubernetes Agent List
Database
Common
-
FeatureIn Analysis > Database Parameter, added the feature to compare between the real-time data and the last saved data when Reference date and Comparison date are all set to the date of today.NoteThis feature is not applied to Redis and MongoDB products.
-
ChangedIn Analysis > Database Parameter, modified to display the collection time in the table's header area. -
ChangedIn Stat/Report > SQL Statistics, modified to select only one instance for the Instance option.NoteThe same changes in specifications are applied in the following products:
-
MySQL: Stat/Report > MYSQL SQL Statistics
-
PostgreSQL: Stat/Report > PG SQL Statistics
-
-
FixedIn Stat/Report > SQL Statistics, fixed the issue where filtering is not applied. -
FixedFixed the issue where thes_equalstring is found in Filter when going to the Stat/Report > SQL Statistics menu by clicking a link such as filter value from other menus. -
FixedIn Stat/Report > SQL Statistics, fixed the issue where a toast message appears if there is no data.
MySQL
-
ChangedIn Management > Agent Installation, improved the installation guide style and configuration. -
ChangedAdded the MariaDB to the supported version field of the product card text on the project installation screen. -
ChangedIn the basic column in Stat/Report > SQL Statistics, modified to hide the elapse wait item. -
ChangedIn Stat/Report > SQL Statistics, moved the sqlHash column to the utmost right.
MongoDB
Fixed In the DB Status widget of Dashboard > Monitoring Multiple Instances, modified to apply the agent selection status immediately.
PostgreSQL V2
-
FixedModified to terminate the real-time view and not to select the time selector when the Session detail window is opened in the Active sessions table on the dashboard with the session terminated. -
FixedModified not to expose the Correlation analysis button when the Session detail window is opened in the Active sessions table on the dashboard with the session terminated.
Log
-
ChangedIn Log > Log Search, changed the display method of the accumulated number of cases when searching logs.-
If the next page can be viewed, number+ appears. Otherwise, number appears.
-
When viewing the next page, the accumulated number of cases appears as 9999+, 19999+, and 29999+.
-
-
ChangedIn Log > Log Configuration, unified Data Retention and the name of Data period into Data retention.
Browser
Feature In the Page Load Hitmap, AJAX Hitmap, and User Session Log Search menus, added the Session replay feature to record and replay all events that users perform on the website.
For more information about the Session replay feature, see the following.
URL
-
ChangedIn URL List, improved the user interfaces.-
Changed the user interface of the Edit URL window.
-
Changed the time selection options.
-
Changed not to expose the Unavailable button to the users without the project Edit role.
-
Modified to create charts based on the chart search time rather than data time.
-
Moved the position of the Delete URL button from the Edit URL window to the list.
-
-
FixedFixed the issue where the Alert status icon on the URL project screen disappears.