Service 2.4.X
Service 2.4.3
May 8, 2024
Common
Fixed In Flex Board 또는 Integrated Flex Board, fixed the dashboard layout restoration issue while modifying the rich text widget.
Service 2.4.2
April 26, 2024
Kubernetes
Fixed From the Start time selection window in Analysis > Multiple Service Hitmap, fixed the issue where the dark theme is not applied.
Service 2.4.1
April 25, 2024
Application
-
FixedIn Statistics > Transaction, fixed the issue where the data is not sorted by error when the Order By is set to Error. -
FixedFrom the hitmap widget in Dashboard > Application Dashboard, fixed the issue where the data is viewed when dragging an empty area on the chart after an agent filtering.
Database
Fixed In Dashboard > Monitoring Multiple Instances, modified the Long Waiting Session Count widget so that its data appears based on the current time.
Service 2.4.0
April 24, 2024
Common
Flex Board / Integrated Flex Board
-
FeatureAdded the Integrated service 2 dashboard template. -
ChangedIn Dashboard list, modified to display the selected product icons on the dashboard. -
ChangedModified the dashboard template preview to display scrolling. -
ChangedModified not to display the project names in the dashboard list within a project. -
ChangedChanged the action so that clicking an instance in the Database status widget brings the corresponding project dashboard. -
ChangedModified the widget template list so that it is not closed when adding a child widget to a group widget.
Alert
-
ChangedIn Event ConfigurationNew, while using the JSON Batch Edit function, removed therelatedPcodeverification logic from the metrics (METRICS) event properties. -
ChangedModified to hide SMS alert and WhatsApp alert columns in the Event notification settings per-user section under Notifications for the projects in which SMS and WhatsApp notifications are unavailable. -
ChangedFrom the Event notification settings per-user section in Notifications, modified not to mask user information to the users with the Member management role. -
ChangedIn Event Configuration, modified to enable addition or overwriting except for the id property when loading real-time log events or composite log events in JSON format. -
FixedIn Event Configuration, removed the logic that verifies theselectproperty as a required value when editing metrics events with a JSON editor. -
FixedIn Event Configuration, fixed the issue where data does not appear properly when running the first simulation and then changing the date and running it again in the complex metrics event settings.
Manage Accounts
Feature In the User phone section under Manage Accounts, added the country code selection feature to general mobile phones.
You can enter only the Korea and Japan country codes.
ETC
-
ChangedChanged the region selection path on the project creation page (in the selection order of region → CSP). -
ChangedIn the following menus, modified the orders for activation toggle and Edit button columns to the leftmost in the list.- Management > Maintenance Plan
- Alert > Event Configuration > Metrics > Notification Message Settings
-
ChangedFor AWS Marketplace account users, added the guidance message after removing the subscription cancelation function. -
DeprecatedDeleted the tutorial button from the side menu.
Application
Common
-
FeatureFrom the Active Transaction Equalizer widget in Dashboard > Application Dashboard, added the option to display inactive agents. -
ChangedIn Management > Agent List, changed Inactive agent deletion time to Inactive agent retention period. -
ChangedIn Analysis > Performance Trend, added units to header columns for the downloaded CSV file. -
FixedIn the Table view tab of the Trace analysis window, fixed the issue where UTC+9 is not applied to the time written in the file downloaded by selecting TXT or SQL. -
FixedIn Statistics > SQL, fixed the issue where a whiteout occurs when specific special characters are included in an SQL statement after selecting the button of the Detailed analysis column. -
FixedFixed the issue where ellipses (...) are applied when the agent name is too long in the agent selection list in Instance Performance Management.
Java
FixedModified the WebLogic installation guide from Add JVM option in Management > Agent Installation:JAVA_OPTS→JAVA_OPTIONS.
Server
-
FeatureIn Alert > Event ConfigurationNew, added the Log File / Window Event setting. -
FeatureIn Alert > Event History, modified to change the time range of the process chart according to the time setting of before and after the alert when the event's detailed information screen appears. -
FixedFrom the server event addition and modification window in Alert > Event Configuration, modified the text in the port notification tooltip. -
FixedDeleted the Server CONF. > Server ENV. Variable. menu from the side menu and sitemap (integrated in Runtime ENV. Variable). -
FixedIn Management > Agent Installation, modified the issue where a wrong Windows version appears: Windows 2008 SP2 or later → Windows Server 2008 R2 or later -
FixedIn Server List > Server Detail, fixed the issue where the layout shakes depending on the screen size when there are many labels below the chart.
Kubernetes
-
FeatureOn the View Detailed screen in Workload > Deployment List, added the ReplicaSet list in the Resource tab. -
FeatureIn Dashboard > Container Map, added the Resource relations tab.TipThe chart allows you to visually check the connections between resources. It is useful to see at a glance the relationships between Namespace, Deployment, ReplicaSet, DaemonSet, Pod, Container, and Application concerning the selected block.
-
FeatureIn Cluster > Object Manifest, added the Kubernetes Event linking feature.NoteThis feature is supported by Kubernetes Master Agent 1.6.1 or later.
-
ChangedChanged the UI for the movement button on the list screen. -
ChangedIn Management > Agent Installation, modified the installation guide text and terms for the Kubernetes agent. -
ChangedModified the icon and button styles in the following menu paths to comply with regulations.-
Dashboard > Container Map
-
Dashboard > Integrated Container Map
-
Cluster > Object Manifest
-
-
ChangedIn Dashboard > Container Map, modified the UI that appears when hovering the mouse over the block. -
ChangedIn Dashboard > Container Map, modified to include unit notation when using metrics options.
Database
Database V2
Feature In Dashboard > Monitoring a Database Instance, added the button to view the data in the Active sessions table at an interval of 1 minute.
PostgreSQL
-
FeatureUnder the Age tab in Analysis > Top Object, added the per_to_wraparound column. -
ChangedIn Analysis > Top Object, changed the guide text that appears when there is no data.
PostgreSQL / MySQL
-
FeatureIn Dashboard > Monitoring Multiple Instances, added the detailed pop-up that displays the disk usage trend. -
FeatureIn Dashboard > Monitoring Multiple Instances, added the following widgets.- Long Active Session Count
- Long Waiting Session Count
PostgreSQL / MySQL / MongoDB
Changed Changed the CPU (xos) metric to be broken down into cpu_sys(xos), cpu_user(xos), and cpu_iowait(xos).
Cloud
Amazon ECS
-
FixedIn the Install guide section of the Management > Agent Installation menu, modified the differences for each language to meet the same standards. -
FixedModified the metric names that are not multilingual to display according to the language environment.
Amazon CloudWatch
-
ChangedIn Management > Agent Installation, changed the label for the Role ARN field from the button format to the text format. -
FixedWith the language set to Japanese, in the Pricing tab of the Management > Agent Installation, modified to go to the Japanese page instead of the Korean page if you select the Price policy link. -
FixedModified the metric names that are not multilingual to display according to the language environment.
Network
Fixed In Dashboard > Network Topology, fixed the issue where the border colors of nodes are applied differently than intended.
Nodes generating outbound traffic are distinguished in green, and nodes generating inbound traffic in gray.
URL
-
ChangedIn Integrated Flex Board, reorganized the UI for the URL list widget.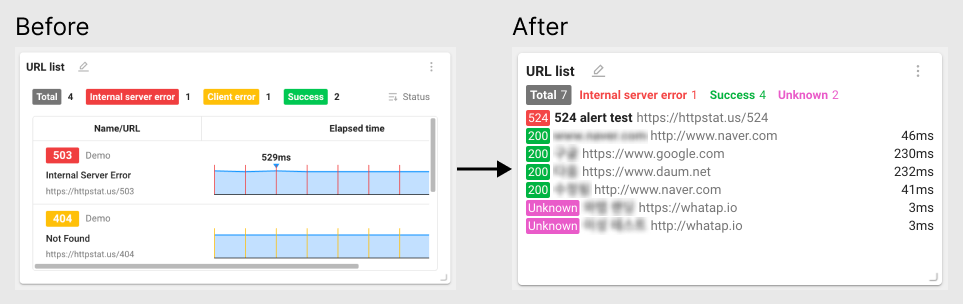
-
ChangedModified to display the URL detail window as a pop-up.
Log
Fixed In Alert > Event Configuration, modified to include spaces in the Search value field for real-time log events under the Log tab.