Service 2.3.x
Service 2.3.15
April 23, 2024
Application
-
FixedIn Statistics > SQL, fixed the issue where a whiteout occurs when specific special characters are included in an SQL statement after selecting the button of the Detailed analysis column. -
FixedFixed the issue where ellipses (...) are applied when the agent name is too long in the agent selection list in Instance Performance Management.
Service 2.3.14
April 9, 2024
Common
-
FeatureIn Alert > Event ConfigurationNew, displayed the Event tab of the existing Event Settings menu, and added the JSON Batch Edit and JSON Batch Download functions.NoteThis feature applies to all products except
CloudandURLproducts. -
FeatureAdded the function to adjust the width of the project list. -
FixedFixed the issue where sorting is misaligned when the group/project name is too long in the project list of the side menu.
Service 2.3.13
April 8, 2024
Application
Fixed Fixed the issue where the scroll bar does not appear if the number of agents selected in Instance Performance Management is relatively high.
Service 2.3.12
April 5, 2024
Application
-
FixedIn Analysis > Daily APP. Status, fixed the issue where data can be searched again by selecting the search button before search is not completed. -
FixedIn Dashboard > Application Dashboard, fixed the issue where data is maintained even if the query period is changed in the Today's TPS and Today's visits widgets.
Service 2.3.11
April 4, 2024
Application
Fixed In Dashboard > Application Dashboard, modified to view all the data for the data in the Today's TPS and Today's visits widgets regardless of agent filtering.
Service 2.3.10
April 3, 2024
Database
Fixed In Dashboard > Monitoring a Database Instance, fixed the issue where the query text does not appear when the SQL details pop-up window is opened.
Service 2.3.9
April 3, 2024
Service 2.3.8
April 3, 2024
Browser
Dashboard
-
FixedModified the query ranges of data for units of 5 seconds, 5 minutes, and 1 hour on the dashboard. -
FixedImproved the TopN chart query method. -
FixedLimited the table widgets to a maximum of 100 views.
Service 2.3.7
April 1, 2024
Application
Fixed In Statistics > SQL, fixed the 414 error that occurs when the Detailed analysis column is selected.
Server
Changed In Server List > Server Detail, modified to use the Group by button on the upper right of the screen by the members with the Alert settings role.
The members with the project Edit or Alert settings role can use the process grouping feature in Server Detail.
Kubernetes
Fixed In Cluster > Node details, changed the values for CPU core and Memory total metrics to the values for CapacityCpu and CapacityMemory fields among the kube_node metrics data.
Service 2.3.6
March 29, 2024
Application
Fixed Fixed the issue where presets are not overwritten after saving in Application Dashboard.
Service 2.3.5
March 29, 2024
Application
-
FixedIf a SQL step is selected in the Table view tab after clicking a node in the Multi transaction tab of the Trace analysis window, fixed the issue where the Variables mapping feature is not exposed intermittently. -
FixedInstance Performance Management > Module Dependency-
With the Node.js and Python projects, added the Module Dependency menu.
-
With the Go project, deleted the Module Dependency menu.
-
-
FixedIn Statistics, fixed the bug where whiteout occurs when the detailed view pop-up window for the Detailed analysis column appears by selecting an agent.
Kubernetes
Feature In Alert > Event Configuration, added the composite metrics event templates as follows:
- The kube-apiserver latency over 10 second
- The kube-apiserver response increase/decrease rate for error codes
Service 2.3.4
March 28, 2024
Kubernetes
Fixed If only the access key is issued without installing the agent after creatintg a project, fixed the whiteout phenomenon that occurs in Management > Kubernetes Agent List.
Service 2.3.3
March 28, 2024
Common
Fixed In Flex Board, fixed the issue where filtering is not applied when the metrics type filter has been applied to the group widget and the Apply group widget filter option has been selected in a sub widget.
Service 2.3.2
March 28, 2024
Database
Fixed In the SQL details window that appears by selecting the query item in the Active sessions table, fixed the bug where the parameter value is not entered correctly when the SQL Statistics menu appears by selecting View SQL Statistics.
Kubernetes
Feature In Management > Agent Installation, added the guide for agent installation using the Helm.
Service 2.3.1
March 27, 2024
Database
Fixed In the MongoDB V2 project, fixed the issue where the Log menu is not exposed.
Kubernetes
-
ChangedIn Analysis > Pod Startup Analysis, added the user guide link on the banner. -
FixedIn Dashboard > Container Map, modified to go from the summary view to the list menu without filtering when a group or all is selected. -
FixedIn Cluster > kube-apiserver Metrics Search, fixed the issue where filtering is not applied when viewing the past data.
Service 2.3.0
March 27, 2024
Release of new features
It provides a guide to the new features released in Service 2.3.0.
Database
New Redis and MongoDB V2 services now launched!
-
The UIs and features of Dashboard have been greatly improved.
-
You can see the database performance metrics in Dashboard.
-
Added the agent selection feature for each cluster in Dashboard > Monitoring Multiple Instances.
-
Added the Log menu that can search for database logs and their trend and configure the log notifications.
-
For more information about new features in Redis Monitoring V2, see the following.
-
For more information about new features in MongoDB Monitoring V2, see the following.
Kubernetes
-
NewAdded the kube-apiserver Metrics Search menu that can view the kube-apiserver collection metrics.Note-
This feature is only for cluster projects. In the Cluster > kube-apiserver Metrics Search path, you can see this feature.
-
For more information about kube-apiserver Metrics Search, see the following.
-
-
NewAdded the Deployment List menu that provides information such as ReplicaSet count, container count, key performance data statistics, and Pod count based on the deployment.Note-
This feature can be seen in the Workload > Deployment List path.
-
For more information about Deployment List, see the following.
-
Browser
New Added the User Session Log Search menu that can search for user session logs.
-
This feature can be seen in the Analysis > User Session Log Search path.
-
For more information about User Session Log Search, see the following.
Common
Flex Board
-
ChangedIn Integrated Flex Board, improved the dashboard copying and sharing features.-
Modified not to view the data for uninvited projects when sharing the dashboard.
-
Modified to share a dashboard depending on the sharing mode regardless of the project roles.
-
Improved to set the sharing modes for each account when sharing a dashboard with multiple audiences.
-
Unified the UI for dashboard copying and sharing.
-
Modified to allow copying only for the dashboards shared in read mode.
-
-
FixedModified to remove the filtered content of the selected project when changing the selected project of the filter in Flex board (each filter is applied on a project basis).
Alert
-
FeatureIn Notifications, added the Opsgenie platform registration function as a 3rd party plug-in. -
ChangedChanged the English name of the Notifications menu (Configuration → Notifications). -
ChangedIn the Add a third-party plug-in function of Notifications, applied the multilingual image. -
ChangedAdded the Notification language option to set the default language for alert notification messages when creating projects. -
FixedInEvent History, fixed the issue where the event occurrence time and event resolution time are displayed with the same time. -
FixedModified the problem where the Notification language option is emptied in Management > Project management, if the project's notification language is "Japanese."
Side menu
-
ChangedModified the side menu to stop the tutorial's initial operation. -
ChangedDeleted the logo tooltip from the top of the side menu. -
ChangedChanged the Organization addition button style of the side menu. -
ChangedModified the side menu to sort the projects in a group by name.
ETC
-
ChangedModified to move to the project creation screen when adding a group upon project creation. -
ChangedIn Analysis > Metrics Search, changed the header to remain fixed when scrolling the table list. -
FixedModified the issue where a value other than the menu name appears in the header when entering the menu. -
FixedDeleted the error message that appears when a user whose payment method is registered as Stripe modifies the Bill recipient setting item.
Application
Common
-
In Dashboard > Application Dashboard the following functions have been added.
-
FeatureAdded the features to adjust the agent list spacing, add the search feature, and sort by name in order. -
FeatureAdded the Agent Active Transaction widget to display active transactions for each agent.
-
-
FeatureIn the Top 30 section of Dashboard > Transaction Map, added the features to add, delete, and filter for IP addresses in IP Filter. -
ChangedIn Statistics > Transaction, added SQL fetch count as Sort by. -
ChangedIn Management > Agent CONF., modified the agent list to be expanded by default. -
ChangedApplied a design system that configures the tab menu of the Instance Performance Management menu into individual submenus. -
ChangedApplied a design system that configures the tab menu of the Statistics menu into individual submenus. -
FixedModified not to display the projects whose error count is 0 when the Trace analysis window is opened by dragging a chart with the Error option of the Hitmap widget enabled. -
FixedIn Dashboard > Application Dashboard, modified the Heap Memory widget-related things.-
In case of PHP, Python, and .Net products, the Heap Memory widget name has been changed to Process Memory.
-
In case of PHP, Python, .Net, and Go products, deleted the System GC column from the detailed information window for heap memory and process memory.
-
-
FixedIn Dashboard > Transaction Map, fixed the issue where the IP filters are not applied in Filter during search of the past data.
Java
Fixed In Management > Agent Installation, deleted the "Optional" displayed on Add JVM option at the Agent installatin guide section.
PHP
-
FixedModified the version on the project installation screen for the PHP products: 8.0 → 8.3 -
FixedModified the data type passed to thewhatap.active_stat_enabledoption in the PHP agent settings fromlongtoboolean.
Node.js
Fixed Modified the instructions (Japanese) on the project installation screen of the Node.js product.
Server
-
FeatureAdded recipient tag setting function in the Log File / Window Event tab of the Event configuration menu. -
ChangedAdjusted roles so that members with the Modify or Alert settings role can use the Maintenance Plan menu. -
FixedIn Dashboard > Resource Equalizer, fixed the issue where the maximum value on the y-axis is not displayed on the Disk IOPS chart. -
FixedFixed the issue where any text in the list goes out of the layout in the Log File / Window Event tab of the Event configuration menu. -
FixedWhen registering the processed records in the Alert status list, modified to display the registration completion tag instead of the process details (count).
Kubernetes
-
FeatureReorganized the Analysis > POD initialization performance menu and changed the menu name to Pod Startup Analysis.The Pod Startup Analysis menu helps manage container resources efficiently by analyzing the startup performance after Pod creation.
-
Changed the flow to start analysis when a Pod is selected instead of provision of a single list.
-
Visualized the performance analysis section.
NoteFor more information about Pod Startup Analysis, see the following.
-
-
FeatureIn Dashboard > Container Map, added the link to the list menu. -
FeatureIn Dashboard > Container Map, added the guide for the Pod phase and phases of the selected category. -
FeatureIn Workload > Container Application List, added the Call infomation tab in the application details. -
FeatureIn Container Map 메뉴의 View Detailed, added the View only selected option that can display only the items selected from the target (container/Pod) list. -
FeatureIn Integrated Container Map, added WhatapProject as the Group by option: grouping by project is possible. -
FeatureIn Cluster > Node List for the Kubernetes cluster project, added the node information column.ExternalIP, InternalIP, InternalDNS, ExternalDNS, Hostname
-
FeatureIn Workload > Container Images, displayed the total number of images. -
In Dashboard > Container Map, the following features have been added and modified.
-
FeatureAdded the Show containers created in less than 1 minute option in the Pod category.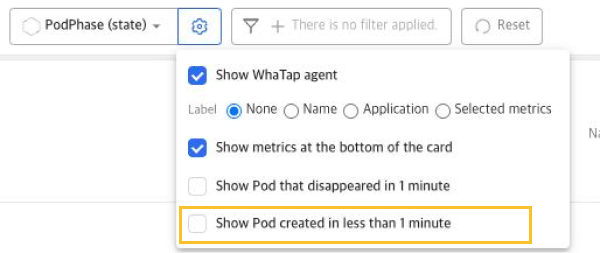
-
FixedAdded the function to display the number of objects at the top of the widget when the grouping option is applied.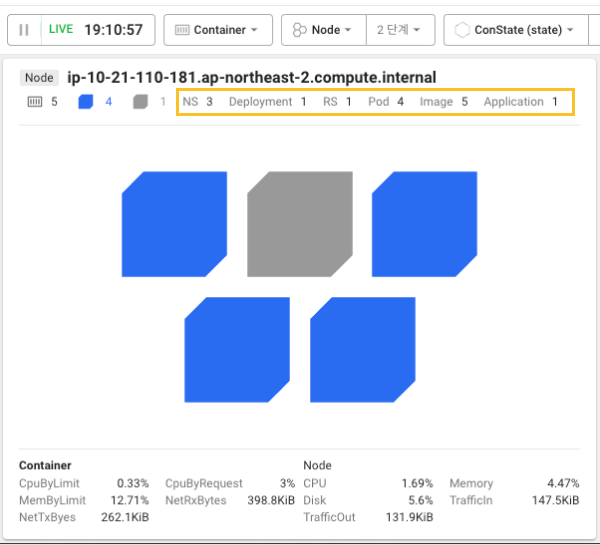
-
FixedIn View Detailed, changed the sorting order of metrics based on the classification.
-
-
FixedUnder APP. > Analysis, added Metrics Chart and Metrics Search. -
FixedFixed the issue where the theme is not applied to the guide text that appears if the Analysis > Pod Startup Analysis(POD initialization performance) menu has no data to load. -
FixedIn Integrated Container Map, when using the Group by option, fixed the issue where the number of objects is intermittently hidden.
Database
Common
-
In
FeatureDashboard > Flex board, added the active session table filter. -
FeatureAdded the real-time/suspension inquiry and the refresh button to the Session detail window. -
FeatureIn Stat/Report > SQL Statistics, added the selection feature for multiple filters. -
ChangedChanged the Session detail window style from modal to pop-out. -
ChangedIn Stat/Report > SQL Statistics, changed the option names as follows:- Lookup criteria → Sort by
- Number of hits → View count
-
ChangedApplied changes to the database product service for changing the xos metric (xos2 → xos).-
In the CPU utilization widget of Flex Board, changed the metric from cpu(xos2) to cpu(xos).
-
From the metric list of custom reports in the MySQL project, changed the metric from cpu(xos2) to cpu(xos).
-
In Alert > Event Configuration, changed the metric of the CPU utilization template among metrics event templates from cpu(xos2) to cpu(xos).
-
-
ChangedOn the dashboard in Dashboard > Monitoring Multiple Instances, modified the style of the widget selection list that appears by right-clicking your mouse. -
FixedIn Flex board, improved the performance of the active session list inquiry.
PostgreSQL, MySQL
-
FeatureIn Dashboard > Monitoring Multiple Instances, reorganized the functions.-
You can change the size and position of a widget.
-
Added several widgets and a deletion feature.
-
Added the preset saving feature.
-
-
In Dashboard > Monitoring Multiple Instances, the following features have been added and modified.
-
FeatureAdded the Default(xos), Default(rds) preset. -
FeatureAdded the function to save the Y-axis values changed in the SQL Elapse Map and Slow Query widgets on the dashboard. -
FixedFixed the issue where the browser temporarily freezes due to the large amount of data being viewed when querying by dragging a chart in the SQL Elapse Map widget on the dashboard.
-
PostgreSQL
-
FeatureIn Management > Agent Installation, improved its design and added the installation guide. -
FeatureIn Stat/Report > PG SQL Statistics, added the selection feature for multiple filters.
MySQL
FeatureIn Stat/Report > MYSQL SQL Statistics, added the selection feature for multiple filters.
MongoDB
Feature In Stat/Report > DB size, reorganized the UI design.
Browser
-
FeatureAdded the user session analyzing feature in the following menu paths:-
Analysis > Page Load Hitmap
-
Analysis > AJAX Hitmap
-
Analysis > User Session Log Search
-