Service 2.10.X
Service 2.10.10
November 22, 2024
Database
Fixed In Dashboard > Monitoring Multiple Instances, fixed the data duplication issue in SQL Elapse Map widget.
Service 2.10.9
November 18, 2024
Common
Fixed Fixed the issue where the search in the organization do not work normally after moving Notification Message Settings.
Service 2.10.8
November 13, 2024
Server
Fixed In Server List > Server Inventory, fixed the issue where custom columns are not saved after modification.
Service 2.10.7
November 11, 2024
Common
Fixed In My Usage > Payment Information, fixed the issue where the AWS Marketplace resubscription button is not activated.
Service 2.10.6
November 8, 2024
Server
Changed Improved the deletion feature of Server List > Server Inventory by replacing it with an API that leaves user action logs.
Service 2.10.5
November 7, 2024
Common
-
FeatureThe inactive agent search feature is provided when searching for Agent/IP in the integrated search of side menus. -
FeatureIn My Usage > Payment Information, provided the AWS resubscription feature. -
ChangedIn Analysis > Metrics ChartNew, improved the data display format for widgets to display up to two decimal places.
Database
Database V1
Fixed In Analysis > Lock Tree, fixed the issue where query text is not visible when the SQL details window pops up.
Service 2.10.3
November 1, 2024
Service 2.10.2
October 31, 2024
Common
Fixed In Alert > Event Configuration New, fixed the issue where the confirmation widow does not appear even if the Overwrite button is clicked when using the JSON Batch Edit feature.
Service 2.10.1
October 31, 2024
Kubernetes
-
FeatureIn Cluster > Ingress List, the feature to display the agent update guidance screen has been added, when the Kubernetes agent version is lower than 1.7.13. -
FixedFixed the issue where the container's Stdout/Stderr logs are not displayed in Dashboard > Container Map for a namespace project.
Database
Fixed Removed the elapse column from Active sessions table in the following menus.
-
Dashboard > Monitoring a Database Instance
-
Dashboard > Monitoring Multiple Instances
-
Analysis > Counts Trend Comparison
-
Analysis > Wait Analysis
Applied platforms: PostgreSQL, Oracle V2, Oracle Pro
Cloud
Fixed Fixed the problem where the Cpu_total_millis and Mem_workingset widgets are not drawn in Amazon ECS > Service.
Service 2.10.0
October 30, 2024
Release of new features
It provides a guide to the new features released in Service 2.10.0.
Kubernetes
New Added the Ingress List menu to monitor metadata and the related information about Ingress resources.
It can be checked in the Cluster > Ingress List path.
Database
-
NewAdded the Cloud Settings menu to collect and monitor resource status data of the cloud database server.Note-
The supported cloud services and products are as follows: Only
V2projects are supported.-
Azure Monitor: PostgreSQL, MySQL
-
AWS CloudWatch: PostgreSQL, Oracle, MySQL
-
-
It can be checked in the Management > Cloud Settings path. For more information, see the following.
-
-
NewIn theV2project for MySQL and PostgreSQL platforms, added the real-time session linked analysis feature with Java platform projects.NoteFor more information about the linked analysis, see the following. MySQL, PostgreSQL
Browser
New Added the Page load statistics menu that provides statistics on the page load performance for each URL path.
This feature can be seen in the Statistics > Page load statistics path. For more information, see the following.
Common
-
FeatureIn Alert > Event History, added the event processed history feature and changed the UI.NoteThe Server product features have been expanded to all products. For more information about the addition of the event processing feature, see the following.
-
ChangedIn Integrated Flex Board or Flex Board, changed the vertical alignment of the displayed guidance message to the center, if there is no dashboard or the list is being loaded. -
ChangedIn Add a third-party plug-in of Alert > Notifications, updated the content in the Webhook JSON input field.-
Added the
uuid,okind, andonodekeys. -
In case of Server products, added the
serverAlertPolicyNamekey.
NoteFor more information about Add a third-party plug-in, see the following.
-
-
ChangedIn Analysis > Metrics ChartNew, changed to search for metrics with the category and field name. -
ChangedIn the Metrics of the Alert > Event ConfigurationNewmenu, applied a new UI for event addition and modification and event list display. -
ChangedChanged the icon of the Language setting menu. -
FixedIn Dashboard > Flex Board, on the dashboard with a responsive layout, fixed the issue where the widgets are not displayed in Print mode. -
FixedFixed the issue where the selected organization is occasionally deselected by clicking Getting Started on the product introduction screen. -
FixedFixed the Japanese message display error when there is a time unit restriction in the time selector.選択できる最大時間は3時です。 → 選択できる最大時間は3時間です。
Application
-
FeatureIn Java platform projects, added the analysis feature that relates the MySQL and PostgreSQL projects and real-time and historical transactions.NoteFor more information about the linked analysis, see the following.
-
FixedFixed the issue where agent aliases are not searched in submenus of Statistics. -
FixedFixed the issue where the Select button on the right of the agent search field in submenus of Statistics is not applied.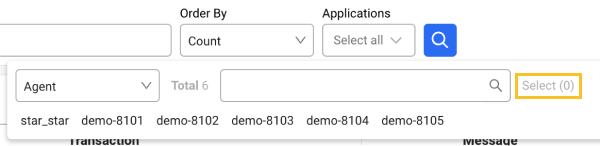
-
FixedFixed the whiteout occurred when the Active Stack button is selected in the Table view tab of the Trace analysis window. -
FixedIn Integrated Flex Board or Dashboard > Flex Board, fixed the issue where PDF files are drawn abnormally when downloaded in some environments.
Server
-
ChangedIn Management > Agent Installation, changed to the installation instructions in the Solaris operating system environment.-
Provided the download links for each Solaris version.
-
Changed to the installation method using the install.sh script file.
-
-
FixedFixed the issue where the guidance text in the filter input field in Server List > Server Inventory is cut off when the language setting is Japanese. -
FixedIn Server List > Server Inventory, fixed the issue where values entered in custom fields are not saved intermittently. -
FixedIn Getting started with log monitoring of Log > Log Configuration, modified the Linux (shell) agent configuration commands. -
FixedIn Management > Agent Installation, fixed typos and link errors in the agent installation content for the HP-UX environment. -
DeprecatedIn the Column Settings feature of Server List > Server Inventory, removed the sorting option.
Kubernetes
-
FeatureAdded the node summary analysis feature in the following menus.-
Dashboard > Container Map
-
Dashboard > Node Map
NoteThis feature is supported in Kubernetes Agent Master 1.4.1 or later.
-
-
FeatureAdded process information to the following menu paths:-
Dashboard > Node Map
-
Cluster > Node List >
 View Detailed
NoteThis feature applies only to cluster projects and is supported on Kubernetes agent 1.7.14 or later.
-
-
FeatureIn Cluster > Node List, added new columns.-
Node info: AllocatablePods, DiskPressure, MemoryPressure, PIDPressure, Unschedulable, HasKubelet
-
CPU: AllocatableCpu
-
Memory: AllocatableMemory
-
-
FeatureIn the Number of objects widget of Dashboard > Cluster Summary, added the link to move to the Object Manifest menu. -
FeatureAdded the QoS class guidance popover to the QoS class related the guidance to Pod in the following menu path:-
Workload > Pending Pod Status
-
Analysis > Pod Startup Analysis
-
-
FeatureIn Dashboard > Cluster Summary, added the widget to display the node status count and its trend. -
ChangedIn Dashboard > Cluster Summary, changed metrics in the following widgets.-
Number of containers
Before change: Running, Waiting, Stoppped
After change: Total, Running, Waiting, Terminated
-
Number of pods
Before change: Available, Unavailable, Desired
After change: Total, Running, Pending, Succeeded, Failed, Unknown
-
Number of containers
-
ChangedIn Dashboard > Performance Summary, removed the following widgets.-
Kubernetes cluster integration performance widget in the cluster project
-
Kubernetes namespace performance widget in the namespace project
-
-
ChangedSupplemented the container status and application information to the container summary analysis of Dashboard > Container Map. -
ChangedIn Container > Container List, modified to diplay the selected deployment details by default, when you go to the Deployment List menu through the Deployment column. -
ChangedIn Container > Container List, changed the UI for comparison.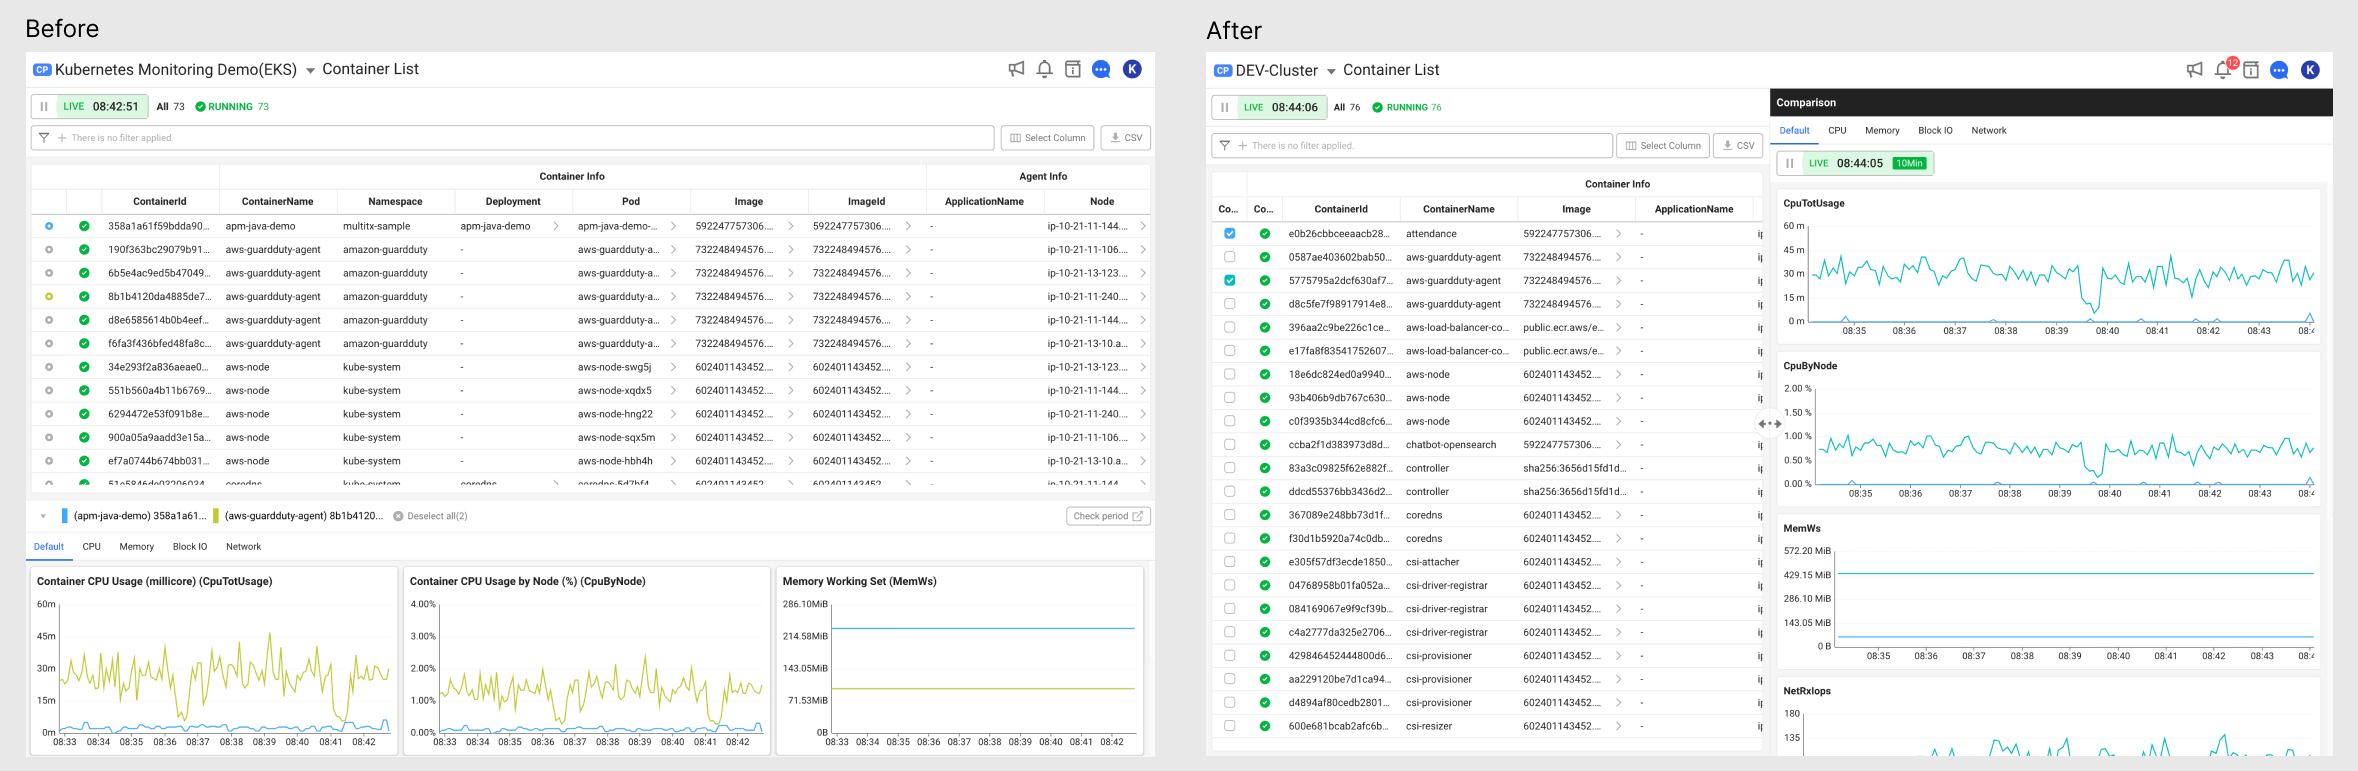
-
ChangedIn Cluster > Node Timeline, modified the minimum selectable time unit to be fixed to 5 minutes. -
ChangedIn Cluster > Node Disk List, modified to move to the Node Detail menu when is selected in the OnodeName column.
 -
ChangedChanged the location of Workload > Service List to under Cluster. -
ChangedIn Management > Agent Installation, added description of the agent version (Stable, Preview). -
FixedIn the summary view of Dashboard > Container Map, fixed the memory leak issue that occurs in the Trace tab and charts. -
FixedIn Dashboard > Node Map, fixed the following:-
Changed the agent supportable version from v1.3.7 to v1.4.1.
-
Style bug fixes: Text theme errors, broken option area
-
Fixed the issue where node data is not displayed properly when querying the past data.
-
Removed unnecessary normal settings during threshold configuration.
-
Database
Common
-
FeatureIn Laboratory > Script Manager, added the default sorting feature to the script list. -
FeatureIn Alert > Event ConfigurationOld, added the metrics event template.NoteThis additional feature is applied to products for Altibase, CUBRID, MySQL, SQL Server, Oracle, Oracle pro, Redis, and MongoDB.
-
ChangedIn Dashboard > Monitoring Multiple Instances, changed the message that appears when more than 4 metrics are added to the custom widget. -
ChangedIn Dashboard > Monitoring a Database Instance, modified to change the table data when the time for the time selector is changed. -
FixedIn Dashboard > Monitoring Multiple Instances, fixed the issue where the graph in the SQL Elapse Map widget is not displayed when stopping the real-time query and querying the past data. -
FixedIn Dashboard > Instance List, fixed the issue where the selected instance is not applied, when you go to the Monitoring Multiple Instances menu by clicking Multi view. -
FixedIn Dashboard > Monitoring a Database Instance, modified to display the message, 'Invalid parameter key.' if the response value isFAIL - Invalid paramkeywhen using the Session kill feature. -
FixedFixed the whiteout that occurs when entering Stat/Report > SQL Statistics menu through the copied link. -
FixedIn Alert > Event ConfigurationNew, added the percent unit (%) into the metrics template. -
FixedIn Laboratory > Script Manager, modified the following:-
Changed the script SQL default format setting to
false. -
Modified to display the left and right scrolls when there are too many script results.
-
Modified the agent path in the guidance message displayed when there is no script list to display the path for each platform.
-
-
FixedIn the side menu, removed the Log File Viewer and File Log Alert menus and modified to check in Sitemap. -
FixedFixed the issue where organization information is released when entering a project to which the agent is not installed. -
FixedIn Analysis > Counts Trend Comparison, fixed the following:-
Modified to display chart colors differently between original and compared dates.
-
Fixed the tooltip not to display the previous date.
e.g. Previous: 2024-10-29 18:38:29 / Present: Compare Time: 18:38:29
-
Modified the tooltip to display the date and metrics.
e.g. Previous: Innodb_buffer_pool_read_requests / Present: Innodb_buffer_pool_read_requests (2024-10-29)
-
-
FixedHided the Laboratory > Script Manager menu on the Redis and MongoDB platforms.
Oracle V2, Oracle Pro
-
FeatureIn Stat/Report > Tablespace Size, added the TOTAL row into the Tablespace size details table. -
FixedModified to check the Oracle CPU core count within a 3-hour range. -
FixedIn Analysis > Lock Tree, changed the event# column name to event.
Oracle Pro
Changed In Management > Agent Installation, modified the button style when installed for a non-Oracle account.
MySQL, PostgreSQL
-
ChangedIn Management > Agent Installation, changed the RDS option setting to Cloud Settings menu link. -
ChangedChanged the UI in Stat/Report > DB size (from the bar chart to the stacked series chart).
Altibase
-
FeatureIn Stat/Report > Tablespace Size, added a table to check the segment size. -
DeprecatedIn Management > Agent Installation, removed the RDS option settings.
CUBRID
-
FeatureIn Stat/Report > DB size, added the TOTAL row into the Tablespace size details table. -
FixedIn Stat/Report > Size details for theV2project, fixed the whiteout occurrence.
MongoDB
Changed Changed the UI in Stat/Report > DB size (from the bar chart to the stacked series chart).
URL
Feature In Add URL, added the IP guidance in the Check location section.
For more information about the guide to regional IPs, see the following.
Network
Fixed Fixed the issue where the icons in Laboratory do not appear properly when the side menu is in collapse mode.
Log
-
FeatureIn Live Tail, supported the drop-down feature to add tags as search filters when tags in the log are clicked.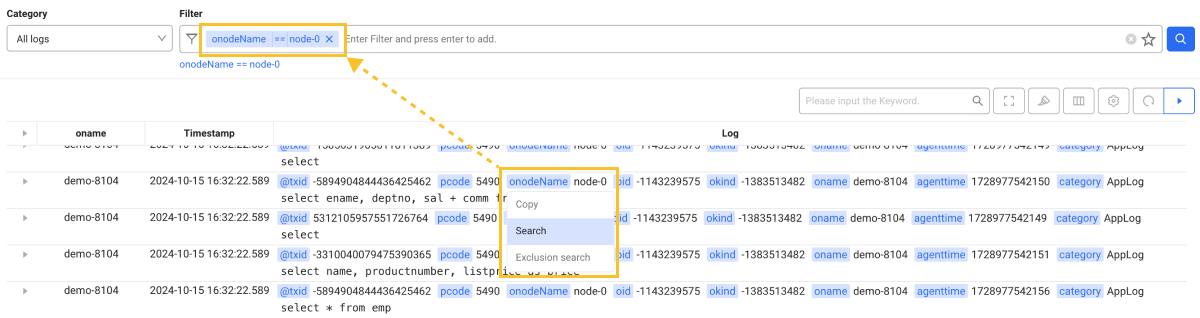 Note
NoteThe Copy, Search, and Exclusion search options are supported.
-
FeatureIn Log Search and Live Tail, added the feature to register desired search conditions as favorites. -
ChangedIn Log primary parser setting of Log > Log Configuration, adjusted the workflow to allow parser patterns to be applied upon successful simulation and performance measurement. -
FixedIn Log Trend, modified to filter the list of candidates for the tag value that matches a keyword. -
FixedFixed the issue where filtering is disabled when the list is updated while a value is entered in the filter input field of the Log Trend menu -
FixedFixed the issue wherectrl+zdoes not work in the pattern input field when running the Simulation feature after entering a pattern in Log primary parser setting of the Log Configuration menu.