Service 2.0.x
Service 2.0.8
January 19, 2024
Common
Fixed In the Metrics tab of Alert > Event setting, fixed the issue where page loading gets slowed too much when there are numerous events.
Service 2.0.6
January 19, 2024
AWS Log
-
In Management > Agent Installation, modified as follows:
-
ChangeModified the S3 guidance text on the installation screen. -
FeatureIn the Install WhaTap Forwarder tab, added Virginia(us-east-1) in the AWS Region list as in Step 2.
-
Service 2.0.4
January 15, 2024
Common
Changed In My usage, changed the fixed billing policy.
For more information about the WhaTap billing scheme, see the following.
Service 2.0.3
January 12, 2024
Application
In Dashboard > Application dashboard, the following functions have been modified.
-
FixedIn the Active Transaction widget, fixed the issue where filters by type have not been applied. -
FixedFixed the issue where all agents are viewed when the Agent by kind or Agent by server option is selected but no agent is selected.
Service 2.0.2
January 11, 2024
Common
Fixed In Stat/Report > Statistics, fixed the bug where a filter from another tab is applied in the SQL tab.
Service 2.0.1
January 11, 2024
Service 2.0.0
January 10, 2024
Common
Dashboard
-
FeatureIn Flex board, added the function to adjust the length of decimal places in auxiliary charts. -
ChangedModified to apply the Y Auto option for all Hitmap widgets by default. -
ChangedIn Flex board, modified the graph chart so that it does not continue when the ranks of the TopN widgets are updated. -
FixedIn Integrated dashboard, fixed the issue where widget tooltips do not disappear. -
FixedFixed the issue where the pop-up window mode ( ) of the widget created on the Flex board does not work in the organization level.
 -
FixedIn Flex board, fixed the problem where the entire project list are not loaded when checking the Hitmap window through the Trace analysis widget, if there is a project for which data cannot be collected with multiple projects selected. -
FixedIn Flex board, modified to always apply the dashboard filters in the Alert list widget. -
FixedIn Flex board, fixed the issue where only several items in the widget list appear when any widgets are added in Group widget.
Alert
Changed In Alert > Event setting, modified the essential input conditions to execute the Test alert function when adding a metric event.
- Previous: Category
- Change: Event name, Category, Level, Message
Stat/Report
Fixed In Report, modified to search the end time based on the next day, if the set end time is earlier than the start time.
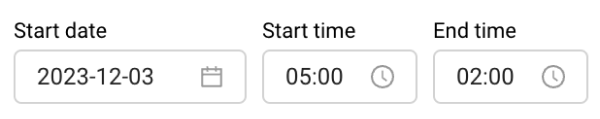
For example, if it is set to Start date 12-03, Start time 05:00, End time 02:00, you can search between 2023/12/03 05:00 and 2023/12/04 02:00.
Integrated report
-
ChangedModified the message that appears when a new report or a duplicated report is generated. -
FixedFixed the bug where the focus does not move in the list on the left when a duplicate report is generated.
My usage
-
FeatureAdded the function to display the usage details when any usage value is clicked in Invoice Preview History. -
ChangedModified to display the promotion banner and not to enter the promotion code even if payment information is not registered. -
ChangedIn Usage, displayed the usage as of the UTC reference date. -
FixedFix the terms that are not multilingual in Quota. -
FixedModified to display a single loading image when entering the Project Subscription Status menu. -
FixedIn Payment information, modified to change the Country/Region item when the Phone is changed to enter or modify the payment information.
User Interface
-
ChangedModified the 1:1 online training text to Apply for WhaTap user training on the chat inquiry screen. -
ChangedModified the guide message so that you can contact us through the chat tool (speech bubble), if an error occurs. -
ChangedChanged the All Platform text to All Category when selecting a product while creating a project. -
FixedExpanded the dark theme to other elements on the service screen.Select
 on the upper right of the service screen, and then click Dark.
Application
-
FeatureAdded the tooltips and related information and multilingual support to each widget in Application dashboard. -
FeatureReorganized the Dashboard > Transaction map menu.- Deleted the TX trace section at the bottom of the screen.
- The detailed information is viewed through the Trace analysis pop-up window that appears by dragging the chart in the Transaction map section.
Note-
For more information about Transaction map, see the following.
-
For more information about Trace analysis, see the following.
-
ChangedIn the HITMAP widget of Application dashboard, added the button that goes to the HITMAP transaction menu. -
ChangedChanged the label display criteria to execution time in Multi transaction > Chart mode on the Trace analysis window.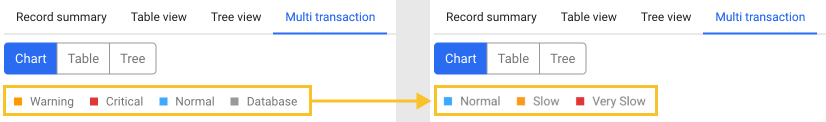
-
ChangedIn Management > Agent Installation of the Java project, modified the code for the JVM option. -
ChangedIn Dashboard > Application dashboard, modified to apply the Y Auto option of the Hitmap widget by default and save the changed Y-axis values. -
ChangedChanged the Node agent installation support version: 7.10.0 → 16.4.0. -
FixedFixed the issue where SQL hash items are not automatically entered when you enter the SQL tab of the Statistic menu on the Trace analysis window. -
FixedFixed the issue where the content of the widget information tooltip does not appear in the older versions of the Application dashboard menu. -
FixedFixed the issue where a time difference happens when downloading the results searched from Trace analysis as a TXT file. -
In Analysis > Stack, fixed the following issues:
-
FixedFixed the issue where update is performed with empty data when there is no filtering result while searching for Active stack. -
FixedFixed the problem where the "No data" message appears first before display of results when searching for Active stack.
-
-
FixedIn Stat/Report > Statistics, fixed the issue where the T/U button does not work when the HTTP call tab is moved to the Transaction tab.
Server
-
ChangedIn Alert > Event configuration, added cautions for event occurrence conditions and targets that are related to the metrics event addition and modification. -
ChangedIn Log > Log setting, modified to display theencodingitem for the agent configuration and script executables differently depending on the set language. -
FixedIn Log > Log setting, modified to operate the agent configuration and script executables normally. -
FixedIn the Display Detail screen in Server list > Server Detail, modified to display the tooltip if its name is too long when the mouse is hovered over.
Database
Common
-
FeatureIn Stat/Report > SQL statistics, added the query preview when hovering the mouse over the query. -
FeatureIn #VALUE! > Agent update, a new UI has been applied and features are reorganized.- The agent download and update progress can be viewed.
- When the update completes, the button is automatically disabled.
DB V2
-
ChangedIn Dashboard > Multiple instance monitoring and Flex board, changed the order of table columns when the Query List window is opened through the SQL Elapse Map widget. -
FixedIn Dashboard > Multiple instance monitoring, modified to display only the running agents in the instance list. -
In Dashboard > Instance monitoring, the following have been modified.
-
FixedChanged the names of some widgets (utilization → utilization). -
FixedFixed the issue when data cannot be searched in a new window for the Active sessions table. -
FixedFixed the screen flickering issue when the Active sessions, Lock tree, Process Info tabs are selected. -
FixedFixed the issue where a same query appears repeatedly when the SQL details window of the selected SQL query has any comment.
-
PostgreSQL / MySQL
-
FeatureAdded the function to display the agent update guidance message in the header when the agent has been installed but it does not support theV2. -
ChangedIn Dashboard > Instance list, the agent update guidance message has been changed.
PosgreSQL V2
-
FeatureIn Analysis > Wait analysis, added the guidance modal for the agent configuration. -
FeatureIn Analysis > Wait analysis, added the function guidance modal. -
FeatureIn Stat/Report > PG SQL statistics, added the query preview when hovering the mouse over the query. -
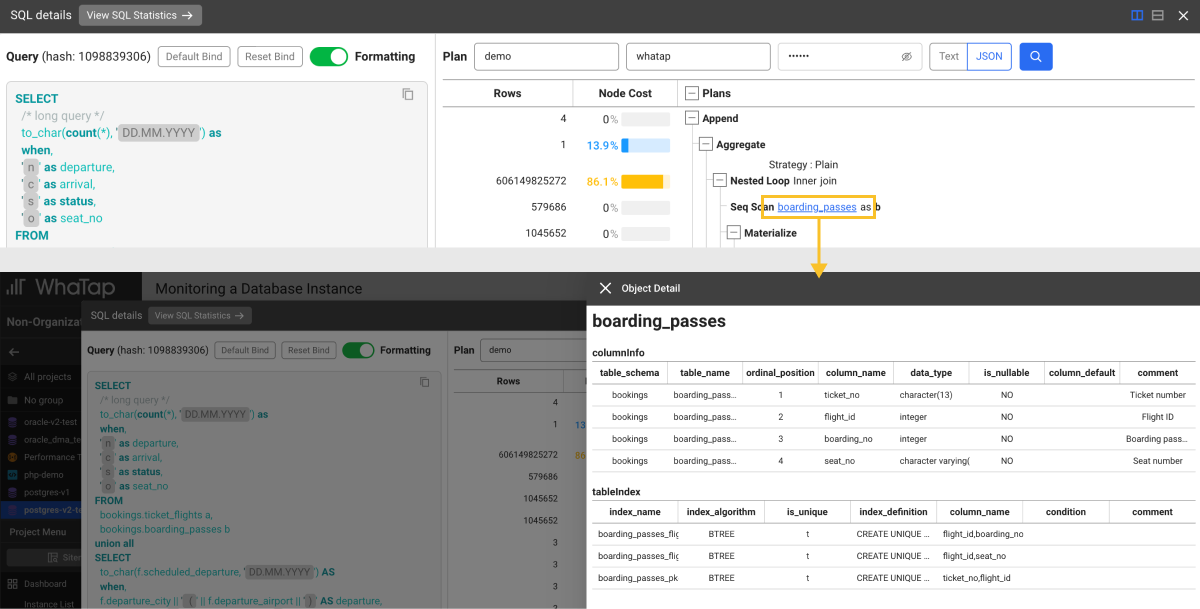
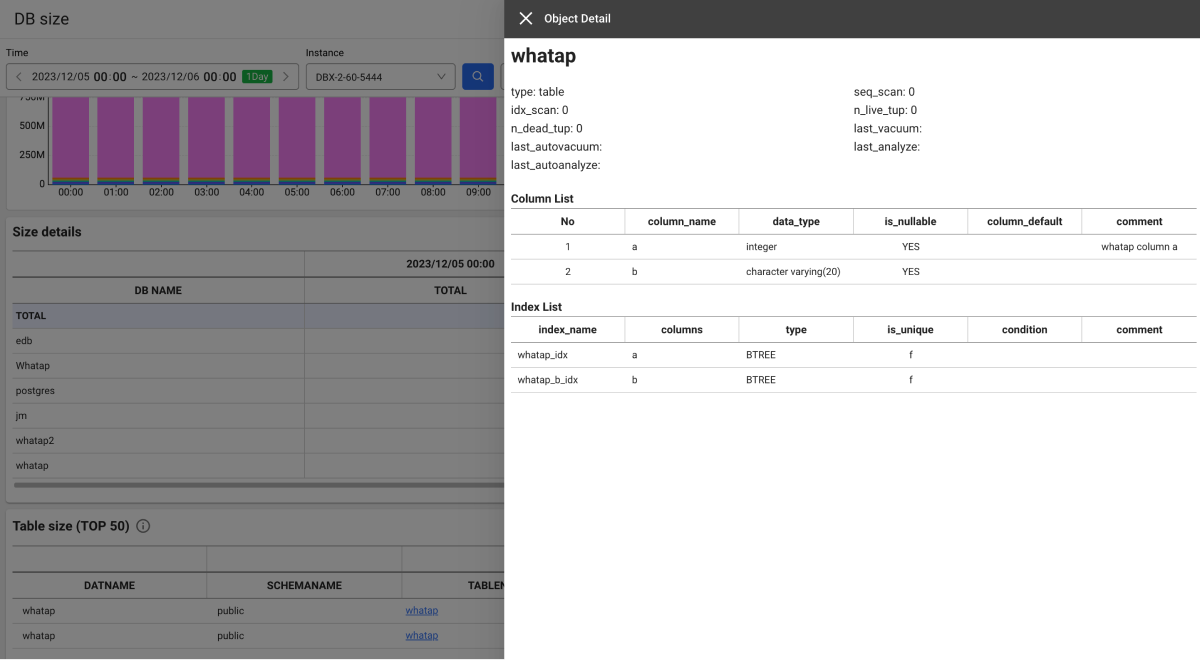
FeatureAdded the function to check the configuration for column and index in the following menu paths:-
In the Dashboard > Instance monitoring, Multiple instance monitoring > Active sessions section, select the query items > view the plan in JSON mode on the SQL details window > click a table or index.
-
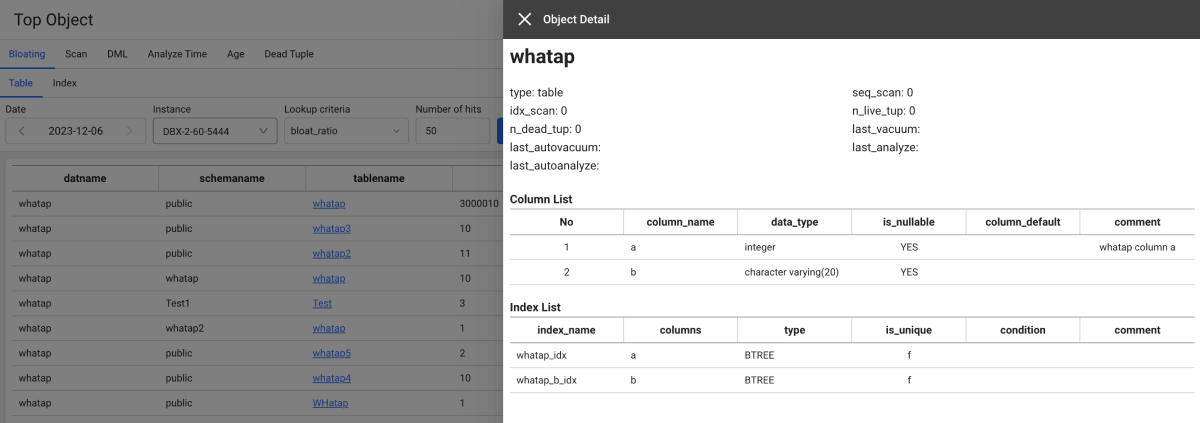
In Analysis > Top Object, click the tablename or indexname column.
-
In Stat/Report > Database size, click the tablename column.
-
MySQL V2
Feature In Stat/Report > MYSQL SQL STATISTICS, added the function to display the preview when hovering the mouse over the query.
Kubernetes
Dashboard
-
ChangedIn the summary view under Container Map, modified to display the container ID with the container name upon query of the current log (Stdout). -
FixedIn Container Map, fixed the title-related bug in the summary view window.
Resource
-
FeatureAdded the function to filter only the selected resources when the status icon is selected at the top of the screen in the following menus:- Resource > Node list
- Resource > Container list
- Resource > Pod List
-
FeatureAdded the following menus under the Resource menu.- Pod List: The Pod list and information details are provided.
- Container Application List: The list and information details of the containerized applications are provided.
- Container Images: The list of images in use is provided.
-
FeatureIn Container list, added the function to move to the Node list menu that filters the nodes when the Node column is selected. -
FeatureIn Cluster Summary, added the lists for Service, Ingress, Job, and CronJob objects. -
FeatureIn Node list, added the metric, - beta.kubernetes.io/instance-type. -
FeatureIn Container Images, added the metrics, - Total Container CPU and Total Container Memory. -
ChangedIn Node list, modified the classification and positions of columns.- Moved the CapacityCpu column from Node info to CPU.
- Moved the CapacityMemory column from Node info to Memory.
-
ChangedIn Performance summary, added Number of containers running on nodes with agents and Number of pods running on nodes with agents, Number of nodes with agents widgets. -
ChangedIn Cluster Summary, added the Total Capacity CPU (total CPU for nodes) and Total Capacity Memory (total memory for nodes) widgets. -
FixedIn Node details, fixed the issue where the server cannot be selected intermittently. -
FixedIn Node list, modified to select only one value when setting any filter with the condition of Equal. -
FixedIn Performance summary, fixed the issue where the content does not appear properly in the widget depending on the user device. -
FixedIn Performance summary, fixed the bug where the time selector's indication is changed from 5 minutes to 30 minutes, when the real-time mode is paused ( ) and then the Restart (
 ) button is selected.
APP
Changed Changed the Japanese menu name of the Multi service hitmap and Custom hitmap menu.
- マルチサービスヒトマップ → マルチサービスヒットマップ
- カスタムヒトマップ → カスタムヒットマップ
Log
-
FeatureAdded the log data search function in the WhaTap Event:#WhatapEventcategory. -
FeatureAdded the Kubernetes Event menu to search Kubernetes events as a project basis.
etc
-
FeatureAdded the Correlated Project Management menu under Management: Registration, view, and deletion of the linked projects. -
FeatureIf there is any linked project, provided the Correlation analysis view for the SQL target server and HTTPURLConnection information in Trace analysis > Table view. -
ChangedReorganized the Analysis > POD initialization performance menu- It is supported in Node agent 1.4.2 or later.
- Extended the support from clusters to the cluster and namespace projects.
- Enhanced the search performance.
- Added the CSV download function.
- Provided the Pod filtering function for the status when selecting the status icon.
-
FixedIn Alert > Event configuration, modified the link set on the Go To The Guide button of the metrics event addition window. -
DeprecatedIn Metrics Chart, deleted theContainercategory of the metrics chart.
Log
-
FeatureIn Log search Live Tail, reorganized the log search filtering function.- Added the query syntax guide to support entry of search values.
- Added the function to change the added tags with keyboard inputs.
- Added the function to create and modify tags and to modify operators by clicking.
-
FeatureIn Alert > Event configuration, enhanced to display the failure reason in a message when the API request has failed while adding or modifying a real-time log event. -
FeatureAdded the function to display colors for log labels when the agent options have been set.whatap.conf# requires agent restart
weaving=log4j-2.17,logback-1.2.8
Browser
-
FeatureAdded a filter to search based on the user ID in the following menus:-
Analysis > Page Load Hitmap
-
Analysis > AJAX Hitmap
-
-
ChangedIn Dashboard > Browser Monitoring Dashboard, modified the map widget by default to display the country with the highest page load based on the lookup time. -
ChangedModified the Japanese menu names on the sidebars of the project. -
FixedIn Browser Monitoring Dashboard, fixed the issue where the data appears as 30 minutes of real time when the time selector is paused and then restarted in real time mode. -
DeprecatedIn Browser Monitoring Dashboard, deleted the following among the time selection options of the time selector.- Real-time 30 minutes
- Real-time 1 hour
- Last 1 week
- Last 2 week
- Last 3 week
Cloud
Fixed In Management > Agent installation, modified to move the link of the Price policy button in the Pricing tab according to the set language.
- Amazon CloudWatch, Azure Monitor, and Oracle Cloud Monitor products