Service 1.96.0
Hotfix: 2023-03-27
Common
Fixed Fixed the problem where CSV is not downloaded after MXQL data query.
Hotfix: 2023-03-20
Container
Fixed In Dashboard > Container Map, fixed the problem where partial matched containers are not displayed when Include is selected as the Filter option.
Hotfix: 2023-03-14
Common
-
FixedIn Management > Maintenance Plan, fixed the problem where a whiteout occurs when the Monthly tab is clicked. -
FixedModified the MXQL query generation logic to fix the bugs that occur when calling the MXQL data while special characters are used in the field names for MXQL queries.
Hotfix: 2023-03-09
Container
Change Improved the UI and content in Management > Agent Installation.
Hotfix: 2023-02-23
Common
Flex Board
Fixed Fixed the bug where a wrong URL path is generated in the Server Disk Treemap widget.
URL
Fixed In URL List, modified to hide the Excel file import button to the users with no View role.
Official Release: 2023-02-22
Common
Changing the terms
Change Changed the term from profile to trace.
Flex Board
-
ChangeModified the Log RPS Board dashboard template.- Change of the default value in the data lookup period: real-time 30 minutes → real-time 12 hours
- Modified the layout height of the Log RPS trend and server status widgets.
- Setting the 4XX, 5XX Count widget's auxiliary table data units
- Changed the widget data call interval for some widgets from 5 seconds to 1 minute.
-
FeatureAdded the Active Transaction TopN widget. -
FeatureHitmap Widget: Added the Copy( ) button in the URL column of the transaction trace table.
 -
FeatureIn the dashboard list under Home > Flex Board, added the Share Dashboard ( ) function.
Analysis
-
FeatureAt the top of the widget in the metrics chart menu, displayed the method to merge times and objects at the top of the widget. -
FixedIn Sitemap > Analysis > Metric Anomaly Detection, replaced the UI logic due to the UI bug upon selection of category and field. -
FixedModified not to change the start date, metrics of interest, and dashboard tab, if query is not finished in CUBE.
Log setting
-
ChangeDeleted the storage column from the Data retention period by category table. -
FeatureIn the Data retention period by category table, added the Daily Log Count column and helps for each column. -
FeatureIn the Log Parser Settings section, when registering the status success rate parser and the 4xx, 5xx parser, added validation so that the parser cannot be registered twice in the same category.
Manages the account information
FeatureIn My Profile, added the message window for final confirmation when enabling the multi-factor authentication.
Management
-
FixedIn Maintenance Plan, fixed the bug where any registered maintenance plan cannot be deleted. -
In Management > Project Member, the following functions have been added.
FeatureAdded the function to display the member affiliation type (group/project) for improved project member management.FeatureAdded the tooltip (deletion is impossible) when the member deletion ( ) button is disabled.
-
In My Usage and Billing Management, the following functions have been modified.
ChangeIn Preview Invoice and Usage, changed the log display and expression units according to the change in log charging policy.- Change of the log display unit: LOGs ⇒ LOG UNITs
- Change of the log expression unit: Changed to display the daily average instead of the log line counts per hour.
- In Preview Invoice, changed to display the log usage in the Metered Units column.
- In Usage, changed the metering summary column for usage details.
My Usage
In Preview Invoice, the following functions have been added.
-
FeatureAddition of grouping buttons for each project or product name column: Provides the previews for time sum, cost average, and billing cost sum. -
FeatureIn the invoice table, added the option to select whether or not to display the product type, platform, product currency, product price, exchange rate, and currency columns.
Application
Active Transaction
Change Modified to make the input value invisible in the secret key field to stop threading.
Transaction Detail
The items have been added and modified in the following menu path.
- Click
on the right of the Dashboard > Application Dashboard > Active Transaction widget > select a finished transaction item > click Show Transaction. - Click
on the right of the Dashboard > Application Dashboard > drag the Hitmap Transaction chart > click a desired item from the TX Trace list. - Drag the Dashboard > Transaction Map > Transaction chart > In the TX Trace list, click
 on the upmost left.
 - Select the finished transaction column on the Dashboard > Active Transaction > Transaction tab > Click Show Trace.
- Drag Analysis > Hitmap > Hitmap Transaction chart > Click a desired item in TX Trace list.
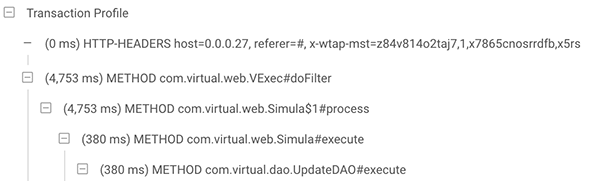
Before modification
![]()
After modification
![]()
-
FeatureMethods: Trace step information provides the analysis of the duplicated methods. -
FeatureSQLs: Trace step information provides the analysis of the duplicated SQLs. -
FeatureAdded the HTTP Calls tab: Provided the HTTP call count, time sum, and time average. -
ChangeChanged the name of the tab menu.- Profile → Table View
- Profile Tree → Tree View
- Log > Transaction Log
-
ChangeModified the design of the Table View tab.- Display of text colors of the method information step (step content column)
- Indentation of the depth information of the method information step (step content column)
- Change of the column name: Cumulative Time → Interval Time
-
ChangeModified the design of the Tree View tab.Before modification
After modification
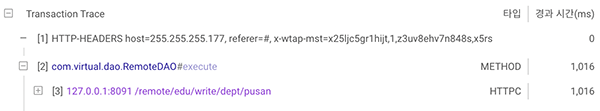
- Display of the text color according to the trace type
- Addition of the data type column (Detail Info, Type, Elapsed Time)
- If the active stack item is clicked, Detail Info confirmation view has been added.
-
ChangeIn Tree View tab, deleted the Start Point CPU Time item from the Method type trace display information. -
ChangeModification of the button name on the transaction chart: Profile Diagram → Diagram
Analysis
-
FixedIn Multiple Transaction Trace > Tree View, fixed the bug where the trace integration data is not represented in a tree structure. -
FixedIn HITMAP, fixed the bug where the End Time column in the TX Trace table appears before the Start Time column.
Server
Server List
Fixed In Server List, fixed the bug where the modal content that appears when the server status icon is clicked does not match that of the selected server.
Database
-
In STAT/REPORT of the Tibero product, the following functions have been added and modified.
-
FeatureImproved the screen UI of the tablespace size.- The tablespace size is provided in the form of a stacked chart.
- Changed the chart data via the Total and Used buttons for stacked charts.
- Provision of the information details in a table
- Data file information can be checked by selecting the toggle buttons for each item.
- Added a bar graph to the Usage (%) column to improve the data visibility.
- Click names for each column to add the table sorting function.
- Added the function to adjust the size of the tablespace name column.
-
ChangeIn the SQL Statistics, added the sql_id column in the statistics table. -
FeatureAddition of the daily/weekly/monthly custom reports- Function to select a metric in the performance trend chart
- Table size increase/decrease, list of tablespace sizes
-
-
In STAT/REPORT for the MySQL product, the following functions have been added.
-
FeatureAddition of the daily/weekly/monthly custom reports- Function to select a metric in the performance trend chart
- Table size increase/decrease, list of database sizes
-
Container
In Dashboard > Container Map, the following functions have been added.
-
FeatureAdded the function to display the container status with a label: Click the button at the top of the screen and then select Container Status.
 -
ChangeIn Display Container Map Detail, modified the design elements of the container and pod lists.- Modified to enable multi-selection without expanding information details even when each item is selected.
- Modified to check information details by selecting the toggle button.
-
FeatureAdded DaemonSet and StatefulSet in the pod category view grouping conditions.
AWS, Azure, NCP, OCI
-
FixedFixed the problem where the registered authentication information does not appear immediately after clicking Change access key after entering the Agent Installation page. -
FixedFixed the problem where the menu path on the screen appears after creating a project as Integration > Install (Management > Install Agent).
URL
Feature In URL List, added the function to fetch the URL list written in an Excel file or export the list as an Excel file: Added the Import/Exportbuttons on the upper right of the screen.