Service 1.94.0
Hotfix: 2023-02-09
Application
Analysis
Fixed In Multiple Transaction Trace > Tree View, fixed the bug where profile integration data is not represented in a tree structure.
Hotfix: 2023-02-08
Common
-
In Management > Project Member, the following functions have been added.
-
FeatureAdded the mark to display whether the affiliation type in the Belong to column from the member list is group or project. -
FeatureAdded the tooltip (deletion is impossible) when the member deletion ( ) button is disabled.
-
-
In My Usage and Billing Management, the following functions have been modified.
-
ChangeIn Preview Invoice and Usage, changed the log display and expression units according to the change in log charging policy.- Change of the log display unit: LOGs ⇒ LOG UNITs
- Change of the log representation unit: Modified to display the daily average for the summed log line count.
- In Preview Invoice, changed to display the log usage in the Metered Units column.
- In Usage, changed the metering summary column for usage details.
-
Hotfix: 2023-02-02
Common
Fixed In Management > Maintenance Plan, fixed the bug where any registered maintenance plan are not deleted.
Hotfix: 2023-01-18
Agent
Fixed Modified the Java, Python, Node.js agent configuration option names.
trace_active_stack_yellow_time→trace_active_transaction_yellow_timetrace_active_stack_red_time→trace_active_transaction_red_time
Official Release: 2023-01-11
Common
Project Creation
-
ChangeChange the menu name from Project List to Product Catalog. -
ChangeChanged the project creation URL path (/v2/account/project/list?add=project → /v2/account/project/create). -
ChangeModified the project creation UI.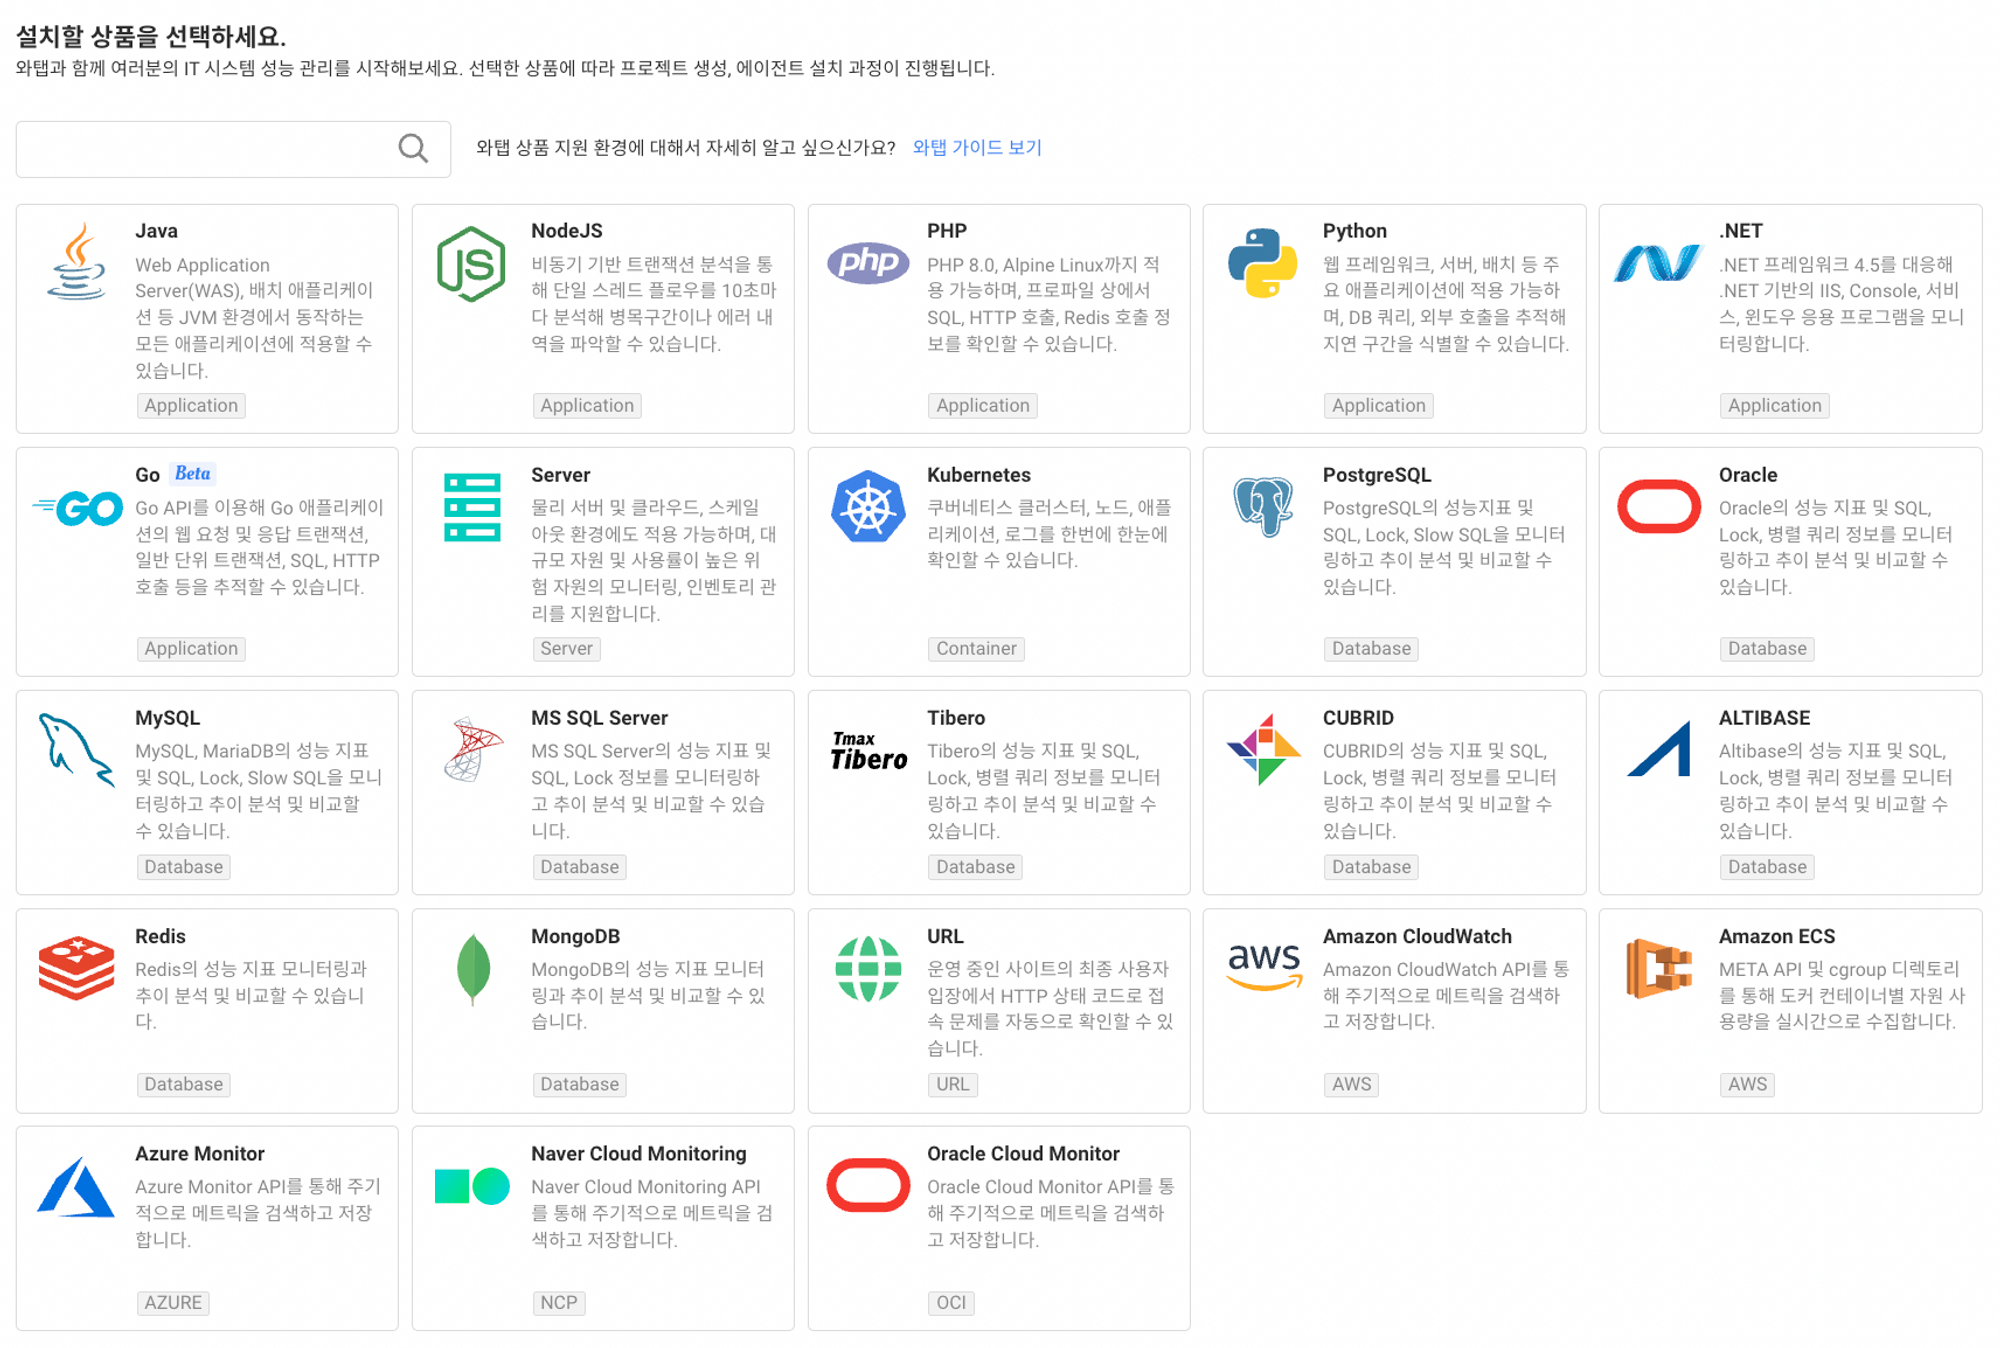
Project list
-
FixedWhen going to the project list by selecting a group on the initial screen, modified to display a loading spinner when a delay occurs. -
FixedFixed the agent count display error in the cluster project card view. -
FixedFixed the problem where the favorites feature malfunctioned. -
ChangeModified to go to the page other than a new window when selecting a project item in the list view.
Dashboard
In Dashboard > Flex Board or Home > Flex Board, added or modified the following functions.
-
FeatureAdded the widget templates.- Maintenance Plan
- Log long-term archive statistics
- Log Count per second
- Log 4XX, 5XX Count
- Request Success Rate
- Log Response Time
-
FeatureAdded the Align function on the upper right of the dashboard list screen. -
FeatureAdd the Log RPS Board template for the server suite products to Dashboard. -
FeatureAdded all category options for the log count widget category selection. -
ChangeAdded the guide tooltip on the dashboard favorite icon. -
ChangeIn the dashboard template list, modified to display icons for available product categories for each item. -
ChangeAdjusted the width of widgets in the dashboard template for ECS products. -
ChangeWhen entering into the project, modified the entry path depending on the installation status of items.- In case any item has been installed: Goes to the dashboard that matches the item type.
- aws: Moved to Amazon CloudWatch > EC2.
- ecs: Moved to Amazon ECS > Task.
- Others: Moved to Flex Board.
- In case the items have not been installed: Moves to Management > Agent Installation.
- In case any item has been installed: Goes to the dashboard that matches the item type.
-
FixedModified to enable deletion when the dashboard is copied as read-only. -
FixedFixed the problem where the cluster cannot be viewed by the hitmap widget. -
FixedWhen creating or editing a dashboard, the dashboard title has been limited to 100 characters. -
FixedWhen using the Filter function after selecting a dashboard, deleted the
  Close button that appears when modifying the saved filters.
 -
FixedModified to open the detailed information window for only the products that support the active transaction function when the equalizer chart is clicked. -
FixedImproved the loading layout of the detailed information window that appears when the active transaction widget is clicked. -
FixedFixed the problem where the animation of the time selection UI option is not updated.
Application Dashboard
-
FeatureAdded a button to the heap memory widget to display the usage as percentage (USED/TOTAL * 100). -
FixedIn the widget's "Display Detail," the chart data interval has been changed from 1 hour to 4 minutes. -
FixedFixed the bug where the screen does not appear when "Show Profile" is clicked for a closed active transaction.
Analysis
In Metrics Chart, added and modified the following functions.
-
FeatureAdded the option to fix the maximum value on Y-axis of the widget chart. -
ChangeModified the function to select multiple agents in the widget. -
FixedModified to change the query period only when the chart dragging range in the widget'sDisplay Detailis greater than 1 minute. -
FixedDisabled the view button not to change the query period of the widget while loading the data request in the widget'sDisplay Detail. -
FixedFixed the bug where all agents are selected when changing the time in the widget. -
FixedIn Application Dashboard, fixed the bug where double selection of agents is made when going to Metrics Chart.
Alert
-
FeatureIn Event Setting > Metrics, added the button to move the Notification message settings menu under Laboratory. -
FeatureIn Event Setting > Hitmap Pattern, added the function to add the Event Receiving Tag beneath each item. -
ChangeIn Event Setting > Metrics tab, modified to sort the alert list by the title. -
FixedIn Event Setting, fixed the bug where the user with no project Edit role cannot modify the alert. -
FixedIn Event Setting > Composite Metrics > Add alert policy, modified not to be saved without entering the title and message. -
FixedIn Event Setting > Composite Metrics > Add alert policy > Creating as a Chart > Show Event > Text mode, fixed the bug where loading continues when changing to the widget type or table. -
FixedIn the Add alert policy window under Event Setting, fixed the bug where the URL path is changed to the application type (apm), if Project Notification Setting Menu or its shortcut is clicked. -
FixedIn Notification Setting > Event Notification Settings Per-User, fixed the bug where invalid time is saved if of the receiving time selector option is clicked and deleted the button. -
FixedIf Event History is accessed for the first time, fixed the bug where the data is not applied to the table list according to the set filters.
Log
-
FeatureIn Setting, added the Log long-term archive statistics panel. -
FeatureIn Setting, under Log Parser Setting, added the 4xx, 5xx Status Code Parser and Status Code Success Rate Parser. -
FeatureIn Setting, added the Log Monitoring Data Setting > Log Data Retention for each category. -
FixedIn Live Tail, fixed the malfunction of the content lookup function. -
FixedIn Live Tail, fixed the malfunction of the content filtering (highlighting) function. -
FixedFixed the issue where in Live Tail, the Tail data calls at an interval of 3 seconds are not delayed.
User Behavior
Fixed In Sitemap > Management > User Behavior, fixed the issue where text in the table overflows outside the table area.
Stat/Report
Fixed In REPORT, added the email address validation test when scheduling the report mailing - modified to allow only period (.), hyphen (-), and underscore (_) as special characters except for Chinese characters and emoticons.
Management
-
In Maintenance Plan, added and modified the following functions.
-
FeatureAdded the function to display the maintenance plan notice at the top of the screen. -
ChangeImproved UIs for maintenance plans.- Change of the repeat option UI text: Daily/Weekly/Monthly/Yearly
- Changed the order of columns in the maintenance plan table.
- Added maintenance plans; enhanced the modification modal UI.
- Modified to select Once by default upon adding a maintenance plan.
- Modified the maintenance plan guide text and its location.
-
FixedModified not to delete any server maintenance plan.
-
-
ChangeDeleted the Integration Items menu; provided the function in Management > Agent Installation. -
ChangeIf the item is ECS, in Management > Agent Installation, repositioned the Activate monitoring button into the installation procedure, which has been fixed at the bottom of the Install guide page. -
ChangeChanged the style of the maintenance plan's guide text at the top of the screen and modified the locations of buttons.
Agent/Server Setting
-
FeatureAdded an icon button to delete disabled agents from the agent list in the following menu paths.- Application, Cluster Project: Management > Agent CONFIG.
- Server Project: Server Setting > Server Setting
-
FeatureIn the following menu path, added the Delete All Disabled Agents button.- Application, Cluster Project: Management > Agent CONFIG.
- Server Project: Server Setting > Server Setting
-
FeatureAdded the agent alias editing function. -
ChangeIn a cluster project, the agent list is divided into master, node, and application units. -
FixedFixed the bug where the search filter does not work in some projects. -
FixedFixed the problem where the agent list is collapsed because the selected agent cannot be clicked while the agent list is expanded. -
DeprecateRemoved the Applying Multiple function from the server project or cluster project.
My Usage, Site Management
-
In Project Subscription, the following functions have been added.
FeatureAdded the Cancel Subscription function for the projects with the subscription time of less than 7 days.FeatureAdded the Delete Project function for the projects that are after 7 days from the subscription time.
-
In Site Management > Billing Management > Subscription History, modified the following functions.
ChangeIn the Monthly Estimation column, modified to additionally display thesession usage details.ChangeModified to display the MYSQL RDS product on the Product Type column.
-
ChangeIn the following menu, added the function to display universal metering information (MtypeDetail) by adding it to Usage > Detail.- My Usage > Usage
- Site Management > Billing Management > Usage
-
ChangeIn Site Management > Billing Management > Invoice, added the Monthly Session Usage column.
Application
Topology
Fixed In Sitemap > STAT/REPORT > Topology > Application Statistics Topology, fixed the issue where an error occurs when an agent is selected.
Analysis
Change In CUBE, changed the chart to zoom in or out the map in the Country widget.
Server
Server List
-
FixedWhile loading the data in Sever List, deleted the message, "No agent installed" and modified to display the loading spinner. -
FixedIn Server Detail, fixed the bug where the search time and the time for the detail view are not matched when clicking "See resource details" in the following menu paths. -
FixedFixed the problem where charts are not drawn properly on the screen when the Server Detail menu appears by selecting several items from the real-time alert list. -
FixedFixed the bug where any disabled agent can be selected in the Agent Transfer window.
 -
FixedModified to display theundefineditem in cells with empty data when downloading CSV, as blank.
Analysis
Fixed In CUBE, fixed the bug where the agent selection filter is not applied to charts.
Server Setting
Fixed In Remote File Viewer, renamed the menu on the screen to match the menu name on the left of the screen.
Database
Dashboard
FeatureIn Instance List for PostgreSQL and MySQL, added the marks M(Master), S(Slave), C(Cluster) in the Server Name column.
Analysis
-
FeatureIn Database Parameter, added the Reference Date and Comparison Date selection option. -
ChangeIn Lock Tree, repositioned the date selection option to the left. -
ChangeIn Dead Lock, changed the time selection option UI.
Stat/Report
-
FeatureIn Table Size Increase, added the Reference Date and Comparison Date selection option. -
ChangeIn Tablespace Size, SGA Size, and Database Size, change the time selection option UI. -
ChangeIn Table Size Increase, added the data unit (MiB) in the detailed information and the sorting function when the table header is clicked.
Container
Container Map
-
NewAdded the Pending Pod function to the Laboratory menu for Kubernetes suite products. -
FeatureAdded CronJob to the related events to provide additional log data to the job-type pods. -
FeatureIn Display Detail, added the container list link (Container Performance) in theContainerIdtag. -
FeatureAdded the function to display Event tab first when PodStatus is in Pending state. -
ChangeModified to display the container count to the tooltips for each pod when one or more containers exist in a pod. -
ChangeModified to display the container lists for each pod in the summary on the right when one or more containers exist in a pod. -
ChangeAdjusted the TX profile window size. -
FixedFixed the bug where the input fields increase when the same values are entered in Critical and Warning. -
FixedFixed the problem where the content blinks when going to the Log tab. -
FixedFixed the bug where some metrics appear asundefinedin the chart metrics (ConState (state)) list. -
FixedFixed the bug where tooltip text does not appear when you hover your mouse over the icon.
icon. -
FixedFixed the bug where the value in the input field is different from the selected value after the Exclude or Include option is selected while using the filter function.
Resources
-
FeatureIn Container List, added the Container Memory Total RSS By Limit (%) metric into the Memory tab that appears upon selection of a container. -
FixedIn Node Details, fixed the bug where the search time and the time for the detail view are not matched when clicking "See resource details" in the following menu paths. -
FixedIn Container List, fixed the screen freezing issue when the number of container lists reaches 1,200.
Analysis
Change In Metrics Chart, fixed the no response status that occurs when searching a tag list that exceeds a specific size: changed the tag list search API search → tags.
Application
-
ChangeIn Hitmap, modified to add the container ID and pod name columns. -
FixedFixed the malfunction of the lookup button in the following menus for the Kubernetes product suite projects.- Application > Daily Application Status
- Application > Perf. Trend
Management
Fixed In Agent Installation > Application Agent, changed the Java agent installation jar file name (whatap.agent-X.Y.Z.jar → whatap.agent.kube.jar).
AWS / AZURE
Project Creation
-
ChangeAdded the installation guide text upon creation of an Azure project. -
ChangeChanged the Validity period(hours) to be entered as mandatory when creating an Amazon CloudWatch project.
URL
-
FixedFixed the link error to the guide shortcut when the Add URL function is used. -
FixedDeleted the real-time query ( ) button in the window that appears after clicking the chart in URL List.
 -
FixedFixed the bug where the content does not appear on the chart upon query in the minute units in the window popping up after clicking the chart in URL List.
Laboratory
Alert message
In New Application, Container, Database, and Server suites, added a new menu: Sitemap > Laboratory > Alert Message.