Service 1.108.x
Service 1.108.22
September 21, 2023
Application
In Analysis > HITMAP, the following have been modified.
-
FixedFixed the bug where the trace data cannot be viewed. -
FixedFixed the bug where the maximum number of rows in CSV download is limited to 1000.
Service 1.108.21
September 19, 2023
Browser
Fixed Fixed the issue where columns cannot be set in full screen mode of the resource table widget.
Service 1.108.20
September 19, 2023
Database
Fixed In Instance list, fixed the agent version checking error in the V2 launching guide pop-up.
Service 1.108.19
September 18, 2023
Container
Fixed In Management > Namespace management, modified the message displayed if the limited project count has been exceeded.
Service 1.108.18
September 14, 2023
Service 1.108.17
September 13, 2023
Application
Fixed In Alert > Event setting, fixed the activation bug of the Save button under the Application tab.
Server
-
FixedIn Dashboard > Resource board / CPU resource map, fixed the bug where the layout does not appear correctly on the Safari browser. -
FixedIn Alert > Event setting, fixed to wrap the metric text to fit the width in Event rule condition under the Add Alert Policy window. -
FixedIn Management > Agent installation, deleted the Silent Install button among the Windows installation file options. -
FixedIn Log > Log setting, modified the directory path of the Windows command code.
Service 1.108.16
September 12, 2023
Database
Fixed In Dashboard > Slow query, fixed the bug where plans are not searched.
Service 1.108.15
September 11, 2023
Service 1.108.14
September 8, 2023
Common
-
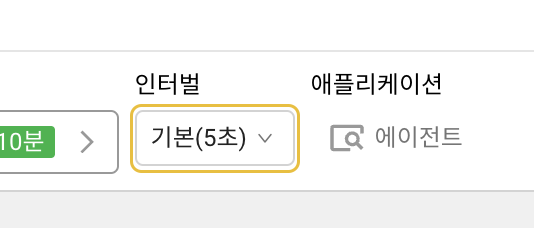
FeatureAdded the function to display the default interval value, if you select Default among the Interval selection options.Before After 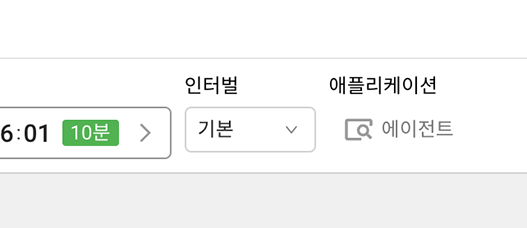
-
ChangedModified to select Default among the Interval selection options, when any time search section is changed.When changing the search section, the Interval option is selected as Default in the following cases:
-
The previous selection in the Interval option is Default.
-
The previous selection in the Interval option is not Default and it is not in the changed Interval option list.
-
The previous selection in the Interval option is not Default and the selected Interval option value is less than half of the search period.
-
-
FixedFixed the error where, in some situations, pressing OK in the Column settings pop-up displays an unknown error message and it does not work. -
FixedIn the card view screen for the Project list of the initial screen, fixed the bug where the application count appears as 0.
Application
-
ChangedIn Management > Agent CONFIG. for the Java project, changed the category for thebiz_exceptionsandignore_exceptionsoptions from Alert option > HTTP outbound call to Exception. -
FixedFixed the issue where the layout is broken when the log search password has been set in the Transaction log tab of the Trace analysis window.
Server
Fixed In Server list > Server list, fixed the bug where the colors of table rows do not change according to the server status change.
URL
Changed In Alert > Notification setting, enabled Avoids a large number of alerts.
Service 1.108.13
September 4, 2023
Container
Fixed Fixed the bug where the mem_working_set series chart does not appear in Out of memory killed container in case of the namespace project.
Service 1.108.12
September 4, 2023
Common
Dashboard
Changed Modified the following in the Transaction analysis window.
-
Modified only the No column cannot be deleted in Column settings for the transaction list.
-
Changed the minimum number of selected columns in the transaction list to 5.
-
Added error options in Filter for the transaction list.
Transaction search
-
ChangedIn Analysis > Transaction search, added the Original URL column. -
ChangedIn Analysis > Transaction search, added the Original URL metric into the downloaded CSV data file.
Service 1.108.11
August 31, 2023
Service 1.108.10
August 31, 2023
Service 1.108.9
August 31, 2023
Common
Dashboard
Changed In the Transaction analysis window, added information on the transaction selection status to the URL for list transaction analysis.
This change can be useful when sharing the URL of the selected transaction with other users.
-
Select a specific transaction from the transaction list, and then copy the URL of the web browser.
-
Go to the URL in the web browser through a new tab or window.
-
You can see that the transaction has been selected in the transaction list.
Alert
Fixed If the language has been set to Japanese, fixed the line break problem in Filtering event targets when any events are added in Event setting > Metrics.
Application
Change In Management > Agent CONFIG., disabled the collapsible function so that you can check all options at a time.
Service 1.108.8
August 30, 2023
Log
Fixed In Log search, fixed the issue where operators are missing after clicking the number (.n) tag in the log and selecting the next item from the drop-down menu.
-
Fixed the issue where the
==operator is missing when Search is selected. -
Fixed the issue where the
!=operator is missing if Exclusion search has been selected.
Service 1.108.7
August 29, 2023
Container
Fixed Fixed the bug where Resource > Performance summary does not appear when you have no View role for the namespace project.
Service 1.108.6
August 28, 2023
Common
Fixed Fixed the problem where some project data is cut off in the project list.
Service 1.108.5
August 28, 2023
Common
-
FixedIn the TOO_SLOW_SQL template in Alert > Event setting > Metrics, deleted the duplicate and unused values for Event rule. -
FixedIf the language has been set to English, modified the unnatural spacing in notification messages displayed in the following cases for the Manage account INFO. menu.-
In case the multi-factor authentication is disabled
-
In case the OTP authentication key is created
-
In case the OTP authentication is canceled
-
Application
-
FixedIn Analysis > HITMAP, changed the default value in the application selection box into Select all. -
FeatureIn the Client IP tab under STAT/REPORT > Statistics, added to display (Whatap) when it corresponds to the WhaTap IP address in the IP list.
Service 1.108.4
August 25, 2023
Service 1.108.3
August 25, 2023
Service 1.108.2
August 24, 2023
Database
Common
Fixed Fixed the abnormal operation of the parameter bind when some special characters are included in SQL parameters.
DB V2 commons
Fixed Modified the guide modal content for the projects that finished agent update.
Log
Fixed In Alert > Event setting > Log, modified to display the log event settings even if there is no granted alert configuration role or the log monitoring is disabled.
Service 1.108.1
August 23, 2023
Common
Fixed Fixed the problem where unreleased product types are exposed in the project list in some menu paths.
Log
Fixed In Alert > Event setting > Log, fixed the issue where the translation is not output when adding or modifying the real-time log event or composite log event.
Browser
Fixed In Dashboard > Browser Error, fixed the problem where a whiteout occurs in the Error log analysis tab when the Error details window is opened.
Service 1.108.0
August 23, 2023
Common
Flex Board
-
FixedIn Flex Board, hided the blog content when creating a Flex Board if the language is not set to Korean. -
FixedIn case of merging the series widget objects in Flex Board, fixed the problem where the maximum and minimum values do not work.
Application
Fixed In STAT/REPORT > Statistics > Transaction, modified the data search range from 5 seconds to 5 minutes, if the range is less than 5 minutes.
Database
Instance Monitoring V1
Fixed Fixed the issue where the widget chart size appears abnormally in the widget count selector modal.
V2 commons
-
ChangeModified the modal UI for the table column selector. -
ChangeModified the Session Kill button to be exposed only to the members with Edit role among project members. -
FeatureApplied to display maximum data values on the line chart. -
In Dashboard > Multiple instance monitoring, the following functions have been added or modified.
-
FeatureAdded the Info icon to display metrics for each widget. -
FeatureSeparated the tabs for each product environment (RDS, XOS). -
ChangeIn the XOS Disk Usage widget, modified asMount Source→Mount Pointamong the table columns (requires an update to the latest version of agent).
-
-
FeatureIn Dashboard > Database Size, Download CSV has been added.
PostgresSQL
Feature In PG SQL statistics, added options to select lookup criteria (temp blocks read, temp blocks written).
MySQL
Change In Management > Agent installation, added the configuration example in whatap.conf under the Download database agent section.
SQL Server
ChangeIn Management > Agent installation, added the configuration command example in whatap.conf under the Download database agent section.
Container
-
FeatureIn Dashboard > Container map, replaced the filter to enhance the function. -
ChangeSeparated the tags in the summary view of Container map into the Target Information tab.
Log
-
FeatureIn Alert > Event Setting > Log > Composite log event, added the templates for function update and addition of the log event template. -
FeatureIn Alert > Log, the filtering is disabled when no category is selected in case of adding the template events with Composite log event. -
ChangeIn the highlight function under Log, changed the colors that can be selected and the log's body font. -
FixedIn Log Search and Live Tail, modified the filter operator from=to!=. -
FixedIn Log Search and Live Tail, modified the search value that appears by entering the numeric keyword,.nto be displayed from+>= 123to>= 123as thecomparison operatorsearch value. -
FeatureAdded the scroll position movement and highlighting functions to the base log from the adjacent logs. -
ChangeIn Alert > Event setting > Log, deleted All from Search key when newly creating a real-time log event. -
FixedIn Log Search, modified not to display the drop-down menu when thepcodetag is clicked. -
FeatureIn Log setting, improved the selection UI for detection of categories and logs.
Browser
Analysis
In Page Load Hitmap, the following have been modified.
-
FeatureIn Page Load Details, added the browser error data and step column. -
FeatureIn Page List, the red font color appears for page load events that include the browser error data. -
FeatureIt has been set to limit the search time to the maximum of 15 days and to make it impossible to search for data older than 30 days in the past.