Comparison between count trends
Home > Select Project > Analysis > Counts Trend Comparison
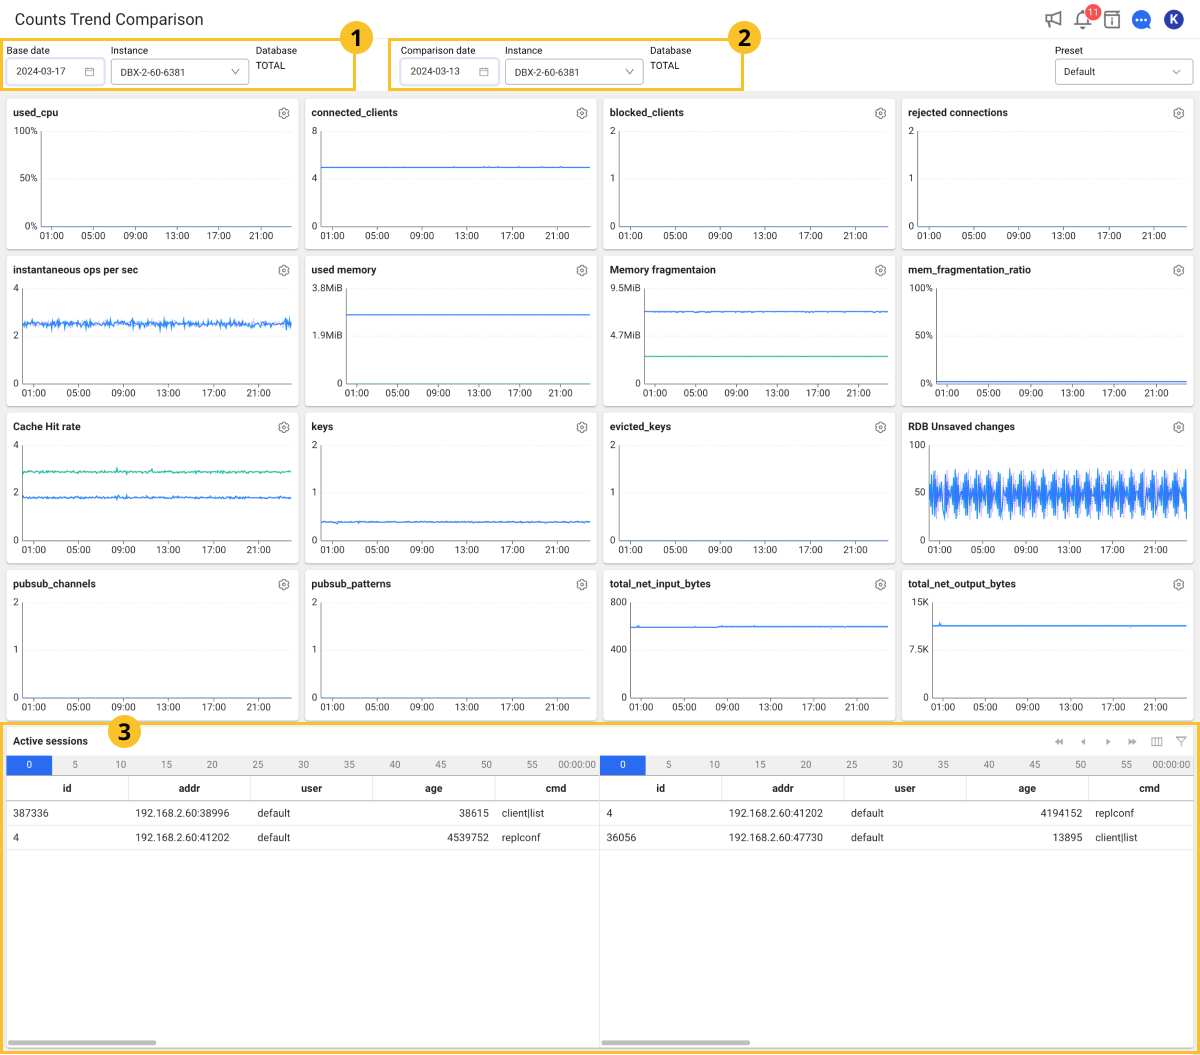
You can check the operation trend of the key metrics of the database over time and trace the performance. You can also check the database operation trend by comparing the count trends on different dates. Through the Active sessions table, you can check active sessions and identify long-running sessions.
Basic screen guide
-
If you select
 Base date,
  Comparison date, and Instance, the data is automatically applied to all widgets based on the selected items.
 -
To see the meaning of the metric displayed in the widget, select
 next to the name or see the following.Note
The tooltip of the
button is not supported in multiple languages. -
To change the position with another widget, select and drag the upper part of the widget. However, the size of the widget cannot be changed.
-
The left of the
 Active sessions table displays the data for the Base date, and the right of the table displays the data for the Comparison date.
 -
In the
Active sessions table, the text colors are changed black → orange → Red, which means that the performance of the session is getting slower.
Selecting a comparison target
Select ![]() Base date and Instance, and then select
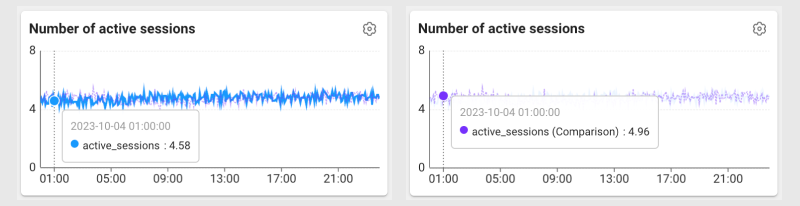
Base date and Instance, and then select ![]() Comparison date and Instance. You can check the data details at the time point through a tooltip that appears by hovering the mouse over the chart. The content of the tooltip is updated based on the position of the mouse.
Comparison date and Instance. You can check the data details at the time point through a tooltip that appears by hovering the mouse over the chart. The content of the tooltip is updated based on the position of the mouse.
-
Each series is given a unique color for easy visual distinction. The solid line represents the data in Base date, and the dotted line represents the data in Comparison date.
-
Compare Time displays the time value of the data where the mouse pointer is located.
-
It displays the metric value at the time point of the selected data, and provides the data by series. Each series includes the data point date, agent (instance) name, metric name, and the value.
Comparing the active session data
-
The time zone for data retrieval can be checked in
 .
. -
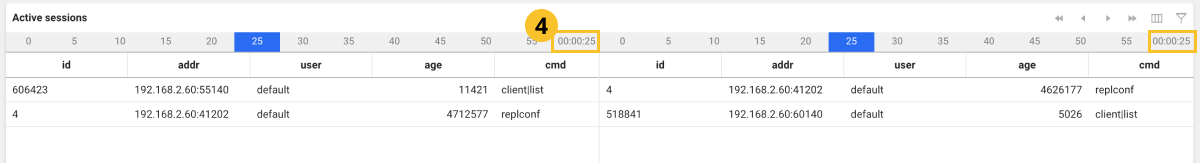
Active session data is collected every 5 seconds. You can search data for the desired time by selecting the button that moves in 5-second increments on the table.
-
If you select
 or
or  on the upper right, you can see the data in 1-minute increments. To move in increments of 5 seconds, select
  or
or  .
. -
In the Active sessions table list, the text colors are changed black → orange → Red, which means that the performance of the session is getting slower.
-
If you click a specific time point of the graph chart, the (
) area appears with a red line and the collected active sessions can be also seen.
Comparing with a specific time
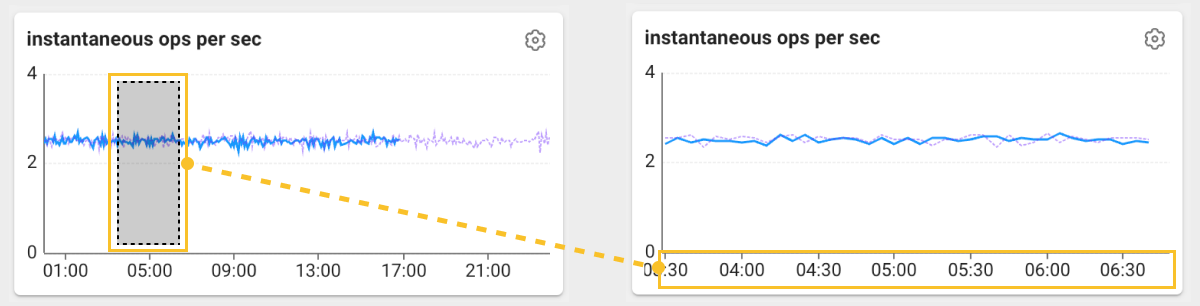
You can compare the data by zooming in on a specific time point. Select a desired time zone to anywhere on the widgets and then drag the chart. It displays the data for a specific time zone dragged to all widgets and active session tables.
Preset
In Monitoring a Database Instance, you can load the custom widget settings and the sorted active sessions as presets.
For more information about the Preset configuration, see the following.
Column information guide
- Active session
- Process information
It is the description of column items in the Active sessions table. For more information, see the following link.
| Item | Description |
|---|---|
| id | Unique 64-bit client ID |
| addr | Client IP address and port number |
| age | Total connection time |
| cmd | Last executed command |
| db | Current database ID |
| events | r: Can read the client socket (event loop)w: Can write the client socket (event loop) |
| fd | Client socket file's descriptor (file descriptor) number |
| flags | The client type, N indicates normal client. (normal/master/replica/pubsub) |
| idle | Time (seconds) whose connection status is idle. |
| multi | Number of commands in the MULTI/EXEC context |
| obl | Output buffer length |
| oll | Output list length (response is queued to this list if the buffer is full) |
| omem | Amount of memory the client uses for output buffers |
| psub | Number of matched subscription patterns |
| qbuf | Query buffer size (0 is not query dependent) |
| qbuf-free | Query buffer free space (0 indicates the buffer is full, no free space) |
| sub | Number of subscription channels |
| user | Client's authenticated username |
WhaTap basically stores the client-related information.
The following items are the metrics collected if the XOS agent has been installed.
| Item | Description |
|---|---|
cputime | CPU usage time |
cpuusage | CPU Utilization |
elapse | Elapsed time of CPU usage |
vsize | Virtual memory size (Kb) |
rss | Resident Set Size (RSS) that is the number of physical pages associated with the process. |
state | Process status |
ioread | Actual time spent reading the block (milliseconds) |
iowrite | Actual time spent writing the block (milliseconds) |
pss | Process specific memory usage + Percentage of shared memory occupied by one process |
uid | user id |
cmd | Executing command |
longcmd | Full path of cmd |