Application report
Home > Select Project > Report
If you click ![]() in Report on the screen, you can see various analysis reports classified by daily, weekly, and monthly. Select a desired report format, and then set the date and time to view and filtering options. You can check the selected report by selecting
in Report on the screen, you can see various analysis reports classified by daily, weekly, and monthly. Select a desired report format, and then set the date and time to view and filtering options. You can check the selected report by selecting ![]() .
.
When generating the weekly and monthly reports, it may take some time depending on the scope of the data view.
Daily Report
It provides the report to check changes in application performance for the day. The provided report form as a daily report is as follows:
Application Daily Report
This report provides a comprehensive analysis of key metrics for application performance for the day.
For more information about key terms and metrics, see the following.
-
Intro: You can see the key performance metrics of the application.
-
PeakTime Summary: You can see the time of the day when the throughput (TPS) was the highest and the metric value of that time.
-
Average/Maximum Value by Metrics: You can check the average values for each key metric for the day and the maximum value based on the time of occurrence.
-
Trend Chart: This time series chart visually displays key metrics of the system. You can check the numbers of key metrics over time. It is an important metric in evaluating the system stability and performance.
Note-
Application Weekly Report provides additional daily changes.
-
On the upper right of the chart, select CSV to download the data in a CSV file format.
-
-
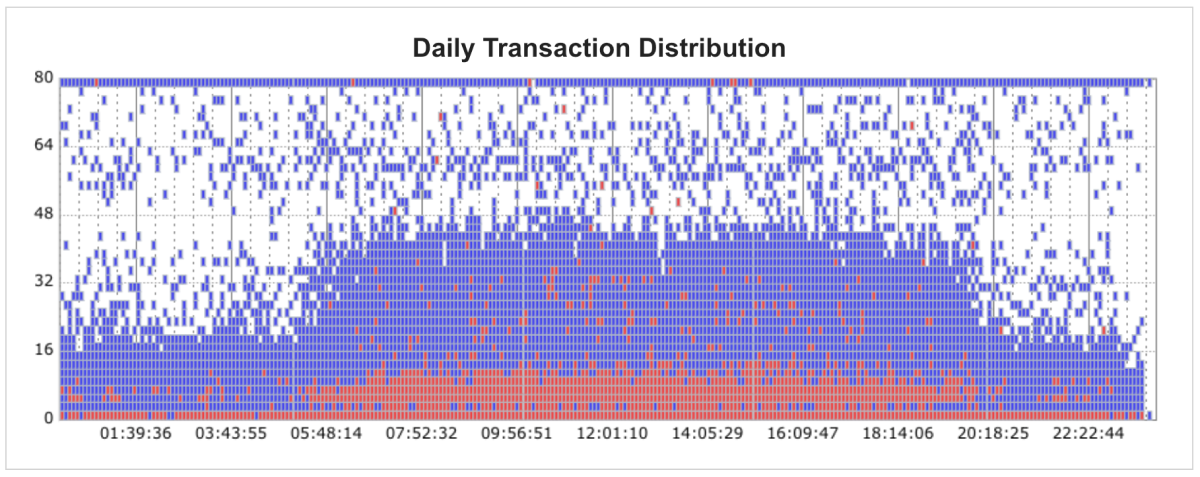
Daily Transaction Distribution: You can see the distribution of transactions and error occurrences by time zone for the day at a glance. The x-axis of the graph represents the end times for each transaction, and the y-axis represents the response times (seconds). Normal transactions are displayed in blue, and erroneous transactions are displayed in red.
-
Application Summary: You can check the status for each monitored agent. Active Count indicates the number of active transactions.
-
Transaction TOP 10: Based on the Transaction Count, Error Count, and Response time average, you can see the top 10 transactions.
-
Top Stack TOP 10: Based on the steps on the stack trace, you can view simplified data calculated as call frequency rates between steps.
NoteIn Analysis > Stack > Top stack, you can view the stack information details.
-
SQL Time Average TOP 10: This is the statistical data sorted by the average response time for the used SQL query statements.
Note-
Increase %: This figure is calculated for the percentage increase by comparing the average data for three days up to the day before the search and the data of the search.
e.g.
4/25 00:00to23:59data inquiry → comparison with4/22 00:00to4/24 23:59data
If the figure is greater than 10%, it appears in red, and it is between 5% and 10%, it appears in orange. The growth rates less than 5% are not displayed. -
In Statistics > SQL, you can view the occurrence time and performance for each query.
-
Application Peak Performance Comparison
For each monitored agent, the application's maximum performance metric appears by comparing with the data for the day (red), the previous day (blue), and the previous week (blue). Each metric displays the maximum value in a specific time zone and the metric value for the corresponding time. This allows you to see performance changes for each application at a glance.
For more information about key terms and metrics, see the following.
Application User Statistics
This report provides a time series chart of the numbers of concurrent users at intervals of 10 seconds, 5 minutes, and 30 minutes and the number of visitors per hour. This report can provide valuable data to help you understand usage patterns and effectively manage user traffic.
-
10s Concurrent User: You can closely monitor real-time traffic changes to identify the time zone when the number of users suddenly increased. You can also establish a strategy to provide content and services during the time zone when users are most concentrated.
-
5m / 30m Concurrent User: Server resources and network bandwidth can be efficiently distributed by analyzing short- to medium-term user patterns. You can also predict the peak time zone and plan to allocate more resources to the period.
-
1h Visitor: You can analyze the user visiting patterns over time and use them in marketing strategies and operation plans.
Daily Metric Trend Charts(Avg/Max)
This report provides various performance metrics for applications in a time series chart. The average and maximum values for each metric are visually displayed. This allows you to monitor the system performance trends and use the data needed for performance optimization and troubleshooting.
The title of the chart is in the Category[Field] format. For more information about the application performance metrics, see the following.
-
Avg.: It is distinguished by the blue line. It displays the average values for each time zone.
-
Max.: It is distinguished by the red line and it represents the maximum values for each time zone.
Application Daily Custom Report
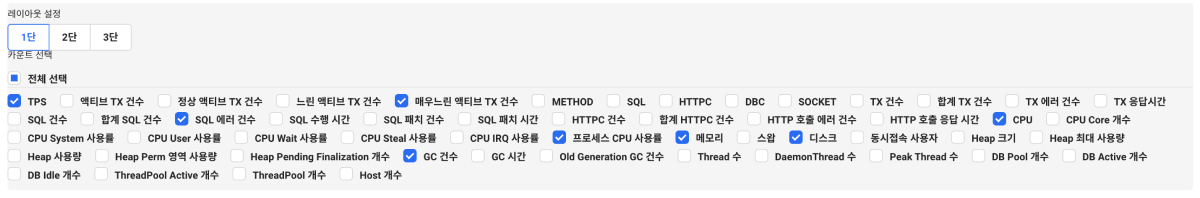
You can create a report by selecting the desired metrics. You can create reports that provide time series charts based on the selected metrics.
-
In Report on the screen, select Application Daily Custom Report.
-
In Layout setting, set the desired number of columns.
-
Select desired metrics. To select all, click Select all.
-
Select
 .
.
The report is generated.
Application Weekly Report
This report can provide a comprehensive analysis of key metrics for applications during the week.
For more information about key terms and metrics, see the following.
-
Intro: Provides the total number of visitors and transactions for the week.
-
Operating Rate: This is the percentage of time when the application ran during a specified period of time. For example, an uptime of 100% means that the application continued to run without a single interruption during the search period. On the other hand, a low uptime rate indicates that the application stopped or abnormal operations happened during the search period.
-
Trend Chart: This time series chart visually displays key metrics of the system. You can check the numbers of key metrics over time. It is an important metric in evaluating the system stability and performance.
Note-
It provides daily variations and daily average and maximum values.
-
On the upper right of the chart, select CSV to download the data in a CSV file format.
-
-
Based on the Transaction TOP 10 Comparison: Transaction Count, Error Count, and Response time average, the top 10 transactions can be seen. It provides the number of executions, increases, and decreases for each transaction from a week ago and the week of inquiry.
-
Top Stack TOP 10 Comparison: A list of top 10 stack traces by comparing the percentage and number of cases from the current week with those from a week ago. You can identify the most frequently called stack.
NoteIn Analysis > Stack > Top stack, you can view the stack information details.
-
SQL Time Average TOP 10 Comparison (Over 100 execute count): This list has been created after comparing top 10 SQL statements based on the SQL average response time. For each SQL statement, it provides the number of executions, average response time, and increase/decrease time for a week ago and the week of the search.
-
Errors in this Project(included Error Msg): This statistical information provides the error statistics for the week's projects based on the error class and messages.
Application Monthly Report
This report provides a comprehensive analysis of key metrics for the application performance during the period of one month.
For more information about key terms and metrics, see the following.
-
Intro: You can see the key performance metrics of the application.
-
Application Summary: You can check the IP Address, OS Information, and Operating Rate for each agent.
-
Trend Chart: This time series chart visually displays key metrics of the system. You can check the numbers of key metrics over time. It is an important metric in evaluating the system stability and performance.
NoteOn the upper right of the chart, select CSV to download the data in a CSV file format.
-
Based on the Transaction TOP 10 Comparison: Transaction Count, Error Count, and Response time average, the top 10 transactions can be seen. It provides the number of executions and increases and decreases for each transaction from one month ago and for the current month.
-
Top Stack TOP 10 Comparison: This is a list comparing the percentage and number of views for the top 10 stack traces from a month ago and for the current month. You can identify the most frequently called stack.
NoteIn Analysis > Stack > Top stack, you can view the stack information details.
-
SQL Time Average TOP 10 Comparison: A list comparing the top 10 SQL statements based on the SQL average response time. For each SQL statement, it provides the number of executions, average response time, and increase/decrease times for one month ago and the current month.
Guide to key terms and metrics
The following lists the key metrics displayed for each report.
| Item | Description |
|---|---|
| Visitor(DAU) (DAU, Daily Active User) / Total Users | It is the number of daily active users or number of users who used the application for a day. |
| Weekly User | Total number of visitors who used the application for a week |
| Monthly Active Users (MAU, Monthly Active User) | Number of unique users who used the application at least once in a month |
| Concurrent User | Number of concurrent users with duplicates removed |
| Users / Realtime Visitor | Number of users who accessed the application at a specific time zone |
| Transaction Count | Number of all requested transactions |
| Total Transaction / Daily Transaction Count | Total number of transactions processed for a day |
| Weekly Transaction Count | Number of transactions requested for a week |
| Daily Transaction Distribution | This distribution chart allows you to see the distribution of transactions and errors by time zone for a day at a glance. |
| Error Ratio(%) | Error rate out of the total number of transactions |
| Event Count | Number of metrics events in Critical level |
| Error Count | Number of failed transactions due to errors encountered while processing transactions |
| Application Count | Number of applications (number of agents) monitored during the search period |
| Total Core | Number of CPU cores used during the search period |
| APDEX*100** (Application Performance Index) | It indicates the customer performance satisfaction with the application for the query period. |
| TPS (TPS, Transaction Per Second) | Number of transactions processed per second |
| Avg Response(ms) / Response Time | Average response time for transactions |
| CPU Core | Number of used CPU cores |
| Visitor Per Hour | Number of visitors per hour during the search period |
| Server CPU Used Percent | CPU utilization of the server |
| Server Memory Used Percent | Memory utilization of the server |
| Active Count / Active TX Count | Number of transactions in progress |
| CPU | CPU utilization |
| Heap(Min) | Minimum heap memory usage |
| Operating Rate | This is the percentage of the normal operation time for the application during a given period of time. |