Correlated project management
Home > Select Project > Management > Correlated Project Management
If you have created a database monitoring (DPM) project and an application monitoring (APM) project, you can relate the two projects for monitoring the data collected from DPM in the APM project.

The Correlated Project Management feature allows you to go beyond product-/equipment-centric monitoring and view monitoring data across multiple projects. This is useful for analyzing how different system components such as applications and databases, interact together. In particular, when performance degradation occurs, you can quickly determine whether it is a hardware problem or an individual application problem, which can significantly reduce the troubleshooting time. Through Correlated Project Management, you can comprehensively analyze performance data at the user system level and obtain more visible insights.
Notes before you begin
- Supportable databases: PostgreSQL, Oracle, MySQL, SQL Server, CUBRID, Altibase, Redis, MongoDB
Adding any linked project
-
Go to Management > Correlated Project Management.
-
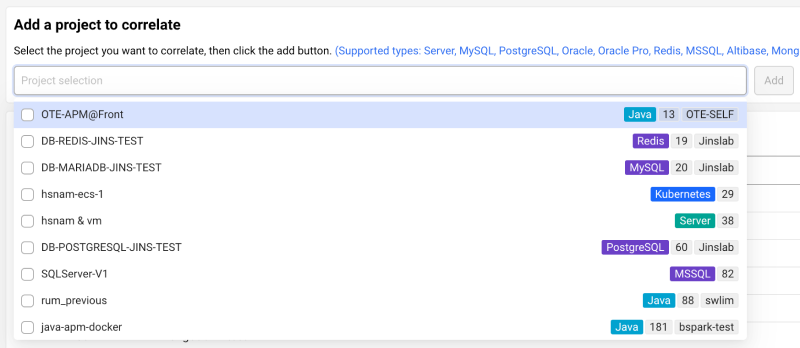
In the Add a project to correlate section, select the Project selection input field.

-
If you see a list of projects, select a project to link to. You can also enter a string to search for matching projects.
-
Select one or more projects and then select Add that is active.
The selected project is added in Correlated project list.
You need the Edit role on the project to add a linked project. If you have the Edit role, the Add button is enabled in the Correlated Project Management menu.
Checking the metrics of the linked project
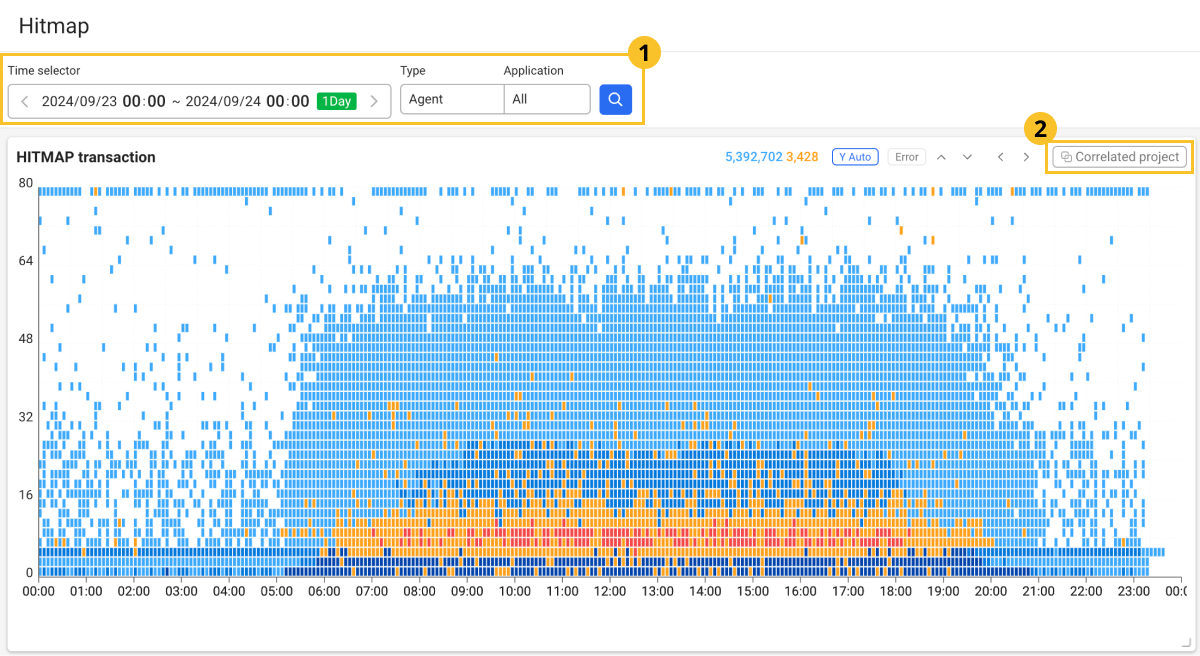
Metrics related to the added project can be checked in the Analysis > Hitmap menu. You can also see performance metrics for the linked project while viewing transactions.
This feature is useful when analyzing transactions in the APM project. When you found a slow SQL, it is difficult to determine exactly in which DB the problem occurred in the environment using multiple similar DBs.

-
Set the time and Application for viewing the transactions, and then select
.
-
In the HITMAP transaction section, select Correlated project on the upper right.
-
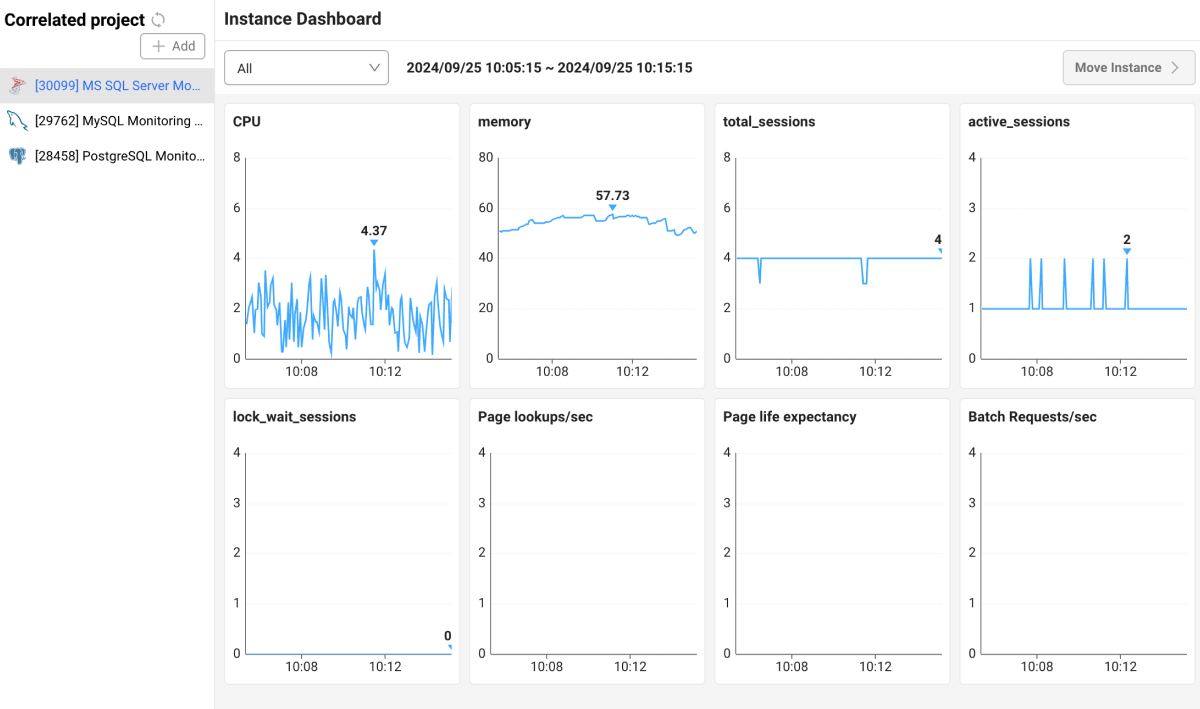
A new window appears where you can check the metrics for the correlated project.

Select the correlated project from the left list and then check the metrics in the Instance dashboard section. Instance dashboard allows you to view key performance metrics of the database associated with the transactions executed in the application.

To navigate to the dashboard menu for a selected project, select an instance and then click Move instance on the upper right. Go to Dashboard > Monitoring a Database Instance.
-
The HITMAP transaction button in the Correlated project section appears only when there is an associated project. For more information about adding a correlated project, see the following.
-
You can add a project by selecting Correlated project at the top of the left Add list.
-
The Move instance button is disabled when All is selected.

-
Depending on the database product type, you can navigate to the Analysis > Counts Trend menu.
Removing any linked project
-
Go to Management > Correlated Project Management.
-
To delete a project to unlink from the Correlated project list section, select
on the utmost right of the list.
-
When the confirmation message appears, select Delete.
The deleted project is excluded from the Correlated project list section.