Statistics
Home > Select Project > Statistics
Select a project in the initial screen of the WhaTap monitoring service, and then select a sub menu under Statistics. The WhaTap agent collects statistical data for the key traces such as transaction information and SQL. A list is created every 5 minutes and it is sent to the server.
Basic screen guide
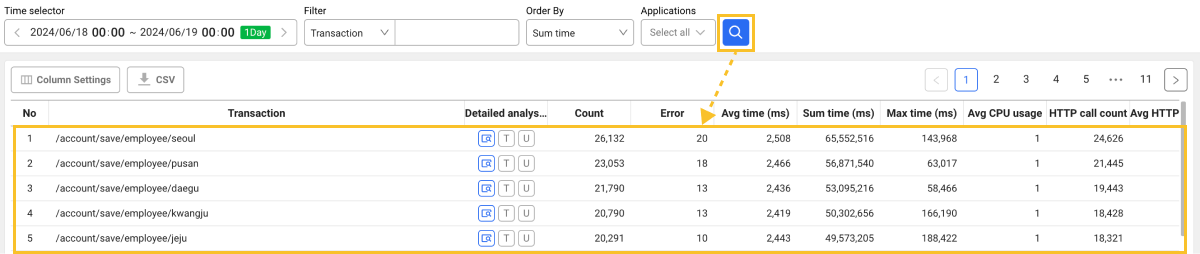
Set the Time selector, Filter, Order By, and Applications and then select ![]() .
.
-
Each Statistics tab provides sorting options by Sum, Max, Time avg, and Count for viewing the list from your desired perspective.
-
You can add or exclude columns to view from the list as well as the default values by using the Column Settings button.
-
When you select
 , the
, the  button appears above the search list along with the search results. If you select the button, you can download the searched list as a CSV file.Tip
If you click
without selecting after a statistics list appears, you can download the CSV file with the changed conditions. -
If you select the
 Display Detail icon in the statistics list, you can check the number of cases and average time chart, and additional charts are provided to compare the case count, error count, and response time. If you select the time to search in the chart, the Transaction Search menu appears.
 -
If you select
Tin the statistics list, the Top stack of URL menu appears. -
If you select
Uin the statistics list, the Unique stack URL menu appears.
-
You can view the data for up to 31 days. However, you can view the data for up to 7 days in Client IP.
-
For more information on how to use the Time selector option, see the following.
Transaction statistics
Home > Select Project > Statistics > Transaction
It collects statistics for transactions. Every 5 minutes, up to 5,000 URL-specific performance statistics are collected and sent to the server. If the number of URLs for 5 minutes exceeds 5,000, this is ignored.
| Columns | Description |
|---|---|
| Transaction | Transaction address |
| Count | Number of execution cases |
| Error | Error occurrence count for the executed transactions |
| Avg time (ms) | Average of the total response time |
| Sum time (ms) | Sum of response times |
| Max time (ms) | Maximum response time |
| Avg CPU usage | Average of the CPU usage time |
| HTTP call count | HTTP call count |
| Avg HTTP call time (ms) | Average of the total HTTP call time |
| SQL count | SQL execution count |
| Avg SQL time (ms) | Average SQL execution time |
| SQL fetch | SQL Fetch Count |
| Avg SQL fetch time (ms) | Average of the total SQL patch time |
Avg memory allocation requires to set the trace_malloc_enabled=true option in the agent configuration (whatap.conf) for collection. The default value is false.
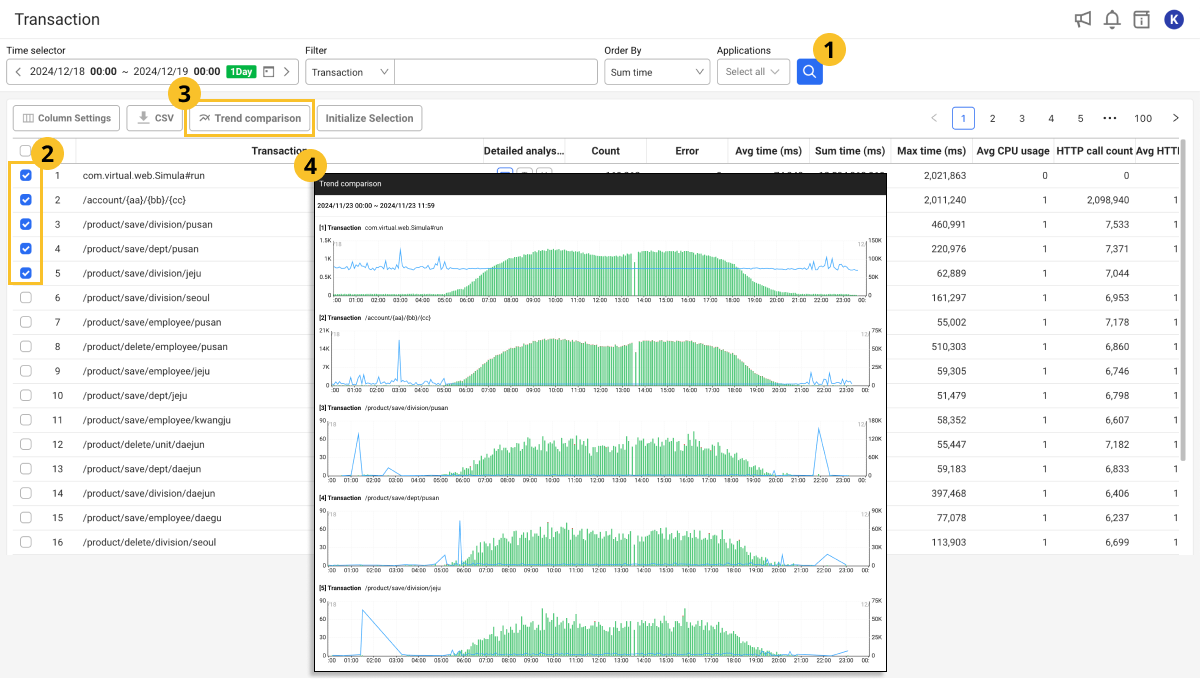
Using the trend comparison feature
You can use the Trend comparison feature to compare multiple transaction trends at a glance. This feature is useful for quickly identifying key issues and resolving traffic issues when there are a large number of transactions to check.
-
Select the time and monitoring target for a query, and then select the
. -
Select one or more transactions to compare from the transaction list.
-
Select Trend comparison.
-
The Trend comparison window appears listing the trend graphs for the selected transactions.
Check the trend graph in the Trend comparison window to compare traffic patterns between transactions. You can compare traffic distributions for specific time periods and service paths.
-
You can select and view up to 100 transactions.
-
If there are a lot of transactions selected, the loading time may increase.
-
For accurate analysis, use the Filter option appropriately.
Transaction domain statistics
Home > Select Project > Statistics > Domain
The WhaTap agent can collect transaction statistics for each domain. In the systems where multiple domains are separated and serviced on a server, domain-specific analysis may be required. Set the following option:
stat_domain_enabled=true
Through the collected data, you can identify the processing status of URLs for each domain.
| Columns | Description |
|---|---|
| Domain | Service domain |
| Transaction | Transaction address |
| Count | Number of execution cases |
| Error | Error occurrence count for the executed transactions |
| Time avg (ms) | Average of the total response time |
Transaction caller statistics
Home > Select Project > Statistics > Caller
If the multi server is connected by a rest call, the relationship statistics between callers and callees can be collected. To collect this data, set the following options:
mtrace_rate=100
mtrace_spec=v1
stat_mtrace_enabled=true

In the above architecture, the Caller & Callee statistics can be viewed only in api1 and api2. The system called by the user browser cannot see the Caller statistics.
However, because the server on the caller side must transfer data, the relevant settings must be entered for all servers.
mtrace_rate=100
mtrace_spec=v1
stat_mtrace_enabled=true
mtrace_spec=v1
stat_mtrace_enabled=true
The statistical data collected is as follows. The data must be viewed from the callee side.
| Columns | Description |
|---|---|
| Caller Pcode | Project code corresponding to the caller |
| Caller agent kind | Group unit to which the agent corresponding to the caller belongs |
| Caller URL | Address of the caller transaction |
| Transaction | Callee transaction address |
| Count | Number of execution cases |
| Error | Error occurrence count for the executed transactions |
| Time avg (ms) | Average of the total response time |
The maximum number of CSV lines that can be downloaded at one time from the Caller menu is 10,000.
IP transaction statistics
Home > Select Project > Statistics > IP Transaction
It provides the feature to view the URLs and number of calls from applications for each specific IP address. This feature is useful for identifying potential security threats or performance issues by checking IP addresses with unusually high request volumes and analyzing the URLs called from those IP addresses. You can block unnecessary or malicious requests based on this information.
You can filter IP addresses or transaction addresses through the Filter option to quickly retrieve data that meets your criteria. This is useful when analyzing specific IPs or transaction address patterns.
| Columns | Description |
|---|---|
| IP | IP address of the client that made the request. |
| Transaction | Addresses of the transactions called and specific path variables are marked with {}. |
| Count | Total number of requests made from the IP address. |
| Error | Number of errors occurred for requests. |
| Time avg (ms) | Average response time for the request (milliseconds, ms). |
-
Abnormal traffic detection: It can detect IPs with an abnormally high number of calls, analyze transaction address patterns from those IPs, and block potential attacks. For example, if there are excessive requests to the
/account/{aa}/{bb}/{cc}URL from a specific IP, you can block the IP or take action to limit requests. -
Response time analysis: It can detect IPs with abnormally high average response times to identify and improve performance issues on the network or server side.
-
Error occurrence analysis: When multiple errors occur from a specific IP, you can diagnose whether there is a problem with the requests from the IP or a problem with the system.
Transaction referer statistics
Home > Select Project > Statistics > Referrer
The WhaTap agent can collect transaction statistics for each referer. Set the following option:
stat_referer_enabled=true
Through the collected data, you can see the referer data on the statistics.
| Columns | Description |
|---|---|
| Referer | Referer address |
| Transaction | Transaction address |
| Count | Number of execution cases |
| Error | Error occurrence count for the executed transactions |
| Time avg (ms) | Average of the total response time |
Error Statistics
Home > Select Project > Statistics > Error
They are statistics on the service errors that occurred for 5 minutes. They collect different errors and transaction names with the keys. They provide the stacks upon error occurrence. The statistics appear for up to 1,000 errors every 5 minutes.
| Columns | Description |
|---|---|
| Class | Error Class |
| Transaction | Transaction address |
| Message | Error Message |
| Count | Error Count |
SQL execution statistics
Home > Select Project > Statistics > SQL
The SQL execution statistics for 5 minutes are collected. A maximum of 5,000 SQL statements are allowed in 5 minutes. If a single Java process generates SQL statements that exceed the limit, they are discarded from statistical data.
| Columns | Description |
|---|---|
| Database | Database Type |
| SQL | SQL query statement |
| Transaction | Data randomly collected from one of the URLs that called the SQL |
| CRUD | Create, Read, Update, Delete |
| Count total | Query execution count |
| Error count | Number of errors among executed queries |
| Avg time (ms) | Average of the total query execution time |
| Sum time (ms) | Sum of query execution times |
| Std dev | Standard deviation for the query execution time |
Transaction collects one of the URLs (last call URL) that called the SQL for 5 minutes for analysis.
HTTP call execution statistics
Home > Select Project > Statistics > Remote HTTP Call
They collect the statistics of calls outside the applications for 5 minutes via the HTTP and HTTPS protocols. A maximum of 5,000 HTTP call statements are allowed in 5 minutes. If a single application process generates external HTTP call statements that exceed the limit, they are discarded from statistical data.
| Columns | Description |
|---|---|
| HTTP call URL | HTTP call URL hash |
| Transaction | Data randomly collected from one of the URLs that requested the HTTP API |
| Host | Host or IP address |
| Port | TCP port |
| Total | Total execution count |
| Error | Error Count |
| Time avg (ms) | Average of the total response time |
| Time sum (ms) | Sum of response times |
| Time min (ms) | Minimum response time |
| Time max (ms) | Maximum response time |
Number of calls for each client IP region
Home > Select Project > Statistics > Client IP
The physical distance between the server and the client is proportional to the data transfer time. It statistically collects call counts for each region of the client IP. The number of different IPs that can be collected per 5 minutes is up to 70,000 per instance.
| Columns | Description |
|---|---|
| Client IP | Client IP address |
| Country/Region | User access country |
| City | User access city |
| Count | Total call count |
-
The data about the client IP can be viewed for up to 7 days.
-
WhaTap basically stores the client-related information. For more information about the agent settings for user data collection, see the following.
Share chart by region
The share chart collects user access locations and presents them for each country and city.
- If a country is selected, the detailed chart appears to display each country's cities and connected user IPs.
- If you select the center circle, it goes to the country selection chart.
Call counts for each user agent
Home > Select Project > Statistics > User-Agent
The numbers of calls for each hash of the user agent string are collected. There is a maximum of 500 different user agent hashes for each instance that can be collected every 5 minutes.
| Columns | Description |
|---|---|
| UserAgent | User agent of the browser |
| OS | OS environment in which the browser runs |
| Browser | Browser type |
| Count | Total collection count |
Client Browser Statistics
Home > Select Project > Statistics > Client Browser
By analyzing the user agent strings, it provides the statistical information based on the browser type and OS used by the end users. You can check the market share through a pie chart created based on the collected statistical information.
| Columns | Description |
|---|---|
| UserAgent | User agent of the browser |
| OS | OS environment in which the browser runs |
| Browser | Browser type |
| Count | Total collection count |