PG SQL Statistics
Home > Select Project > Stat/Report > PG SQL Statistics
SQL statistics (execution count, execution time, row count, etc.) provided by PostgreSQL that can be collected through the pg_state_statements view.
-
Because the delta values are calculated and collected from
pg_stat_statementsevery hour, the collection begins 1 hour after configuration. -
When collecting data every 1 hour, up to 5,000 cases are collected based on
total_time. -
For more information about the
pg_stat_statementsmodule, see the following link.
Before use
To use PG SQL Statistics, the following settings are required in the target monitoring DB.
-
Install the PostgreSQL extension pack.
yum install postgresql-contrib -
Configure the parameters in postgresql.conf and then restart the DB.
postgresql.confshared_preload_libraries = 'pg_stat_statements' -
Install the extension module after connecting the DB to use.
create extension pg_stat_statements; -
Check that the data query is possible.
select * from public.pg_stat_statements
See the following DBX agent options for the criteria on how to collect data. It views pg_stat_statements and performs collection if the rows value is greater than statements_min_row.
# default 10000 row
statements_min_row=10000
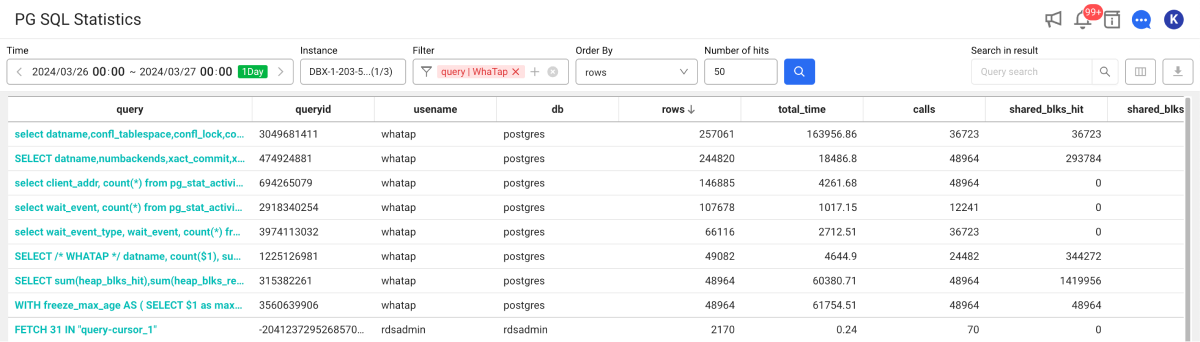
Basic screen guide
-
Select the time and date to view data in Time. You can also select a lookup time by clicking the green button.
-
Select a target to view data in Instance.
-
Select
 .
.
The top 50 entries appear in the table.
-
Select the clock display area to query a random date and time. If you click the text range for date and time, the option appears to select the date and time.
-
If you select each column in the table header, you can sort the list by the selected item.
-
You can sort the searched results according to the items selected in Sort by. Select a desired item and then select
 .
. -
In View count, you can set the number of items to display in the table. After all settings are finished, select
. -
To download the viewed data as a CSV file, select
 .
. -
If you select query from the searched result list, the SQL details window appears. For more information, see the following.
-
For more information on how to use the Time option, see the following.
Column information guide
| Item | Description |
|---|---|
query | Query string |
queryid | Query hash code |
user | User oid |
db | Database name |
rows | Total number of rows retrieved or affected |
total_exec_time | Total query execution time (milliseconds) |
calls | Execution count |
shared_blks_hit | Total shared block cache hit count |
shared_blks_read | Total number of shared blocks read from disk |
blk_read_time | Total block read time (milliseconds) while track_io_timing is active. Otherwise, the value is 0. |
blk_write_time | Total block write time while track_io_timing is active. Otherwise, the value is 0. |
local_blks_dirtied | Number of changed local blocks |
local_blks_hit | Local block cache hit count |
local_blks_written | Total number of local blocks written in disk |
local_blks_read | Total number of local blocks read from disk |
shared_blks_written | Total number of shared blocks written in disk |
shared_blks_dirtied | Total number of changed shared blocks |
temp_blks_read | Total number of temporary blocks read from disk |
temp_blks_written | Total number of temporary blocks written in disk |
Previewing the query
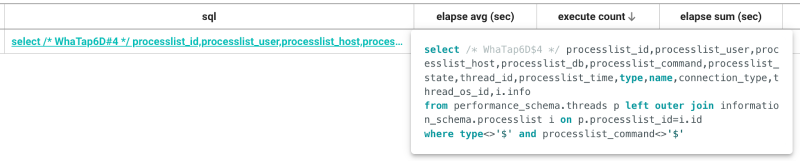
You can preview the query statement by moving the mouse pointer to the query column in the search results list.
See query details
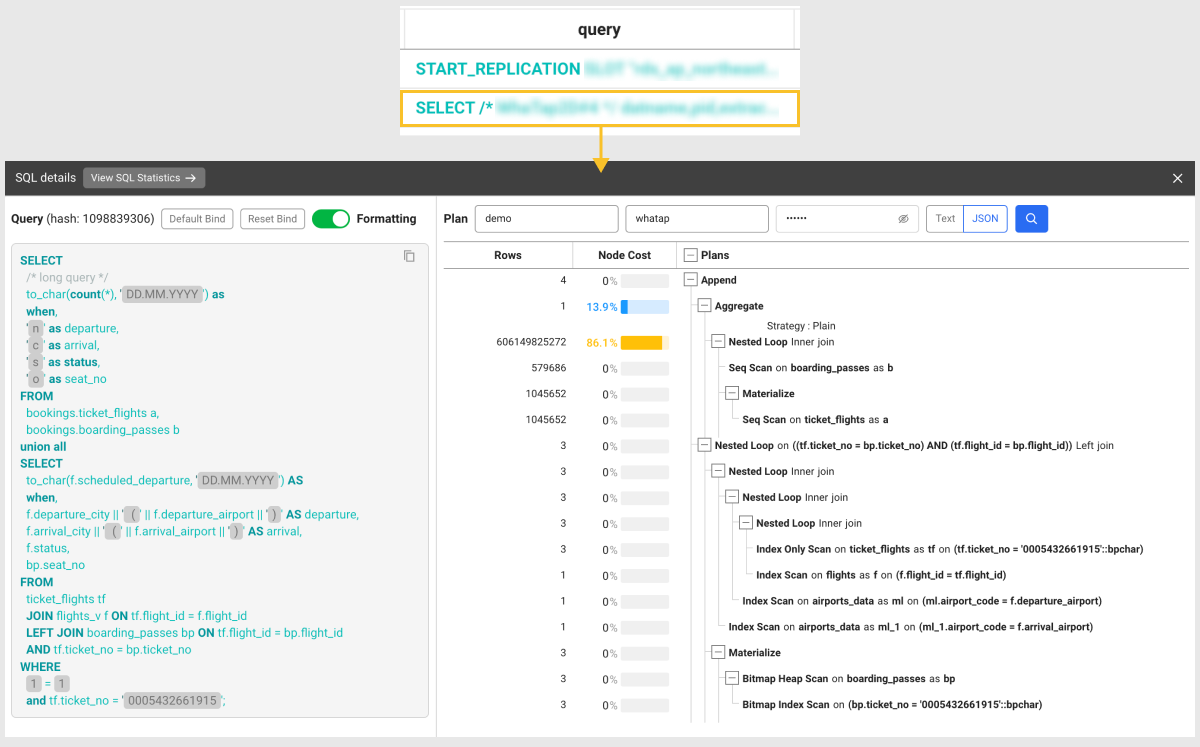
- View SQL Statistics: You can go to the SQL statistics menu where you can check statistical information related to the SQL query statement.
-
Default Bind: You can bind the part set as a variable in the query sentence to the default value.
-
Reset Bind: You can release the bound default value and check the variable.
-
Formatting: You can improve readability by applying indentation and formatting to a SQL query statement.
-
Plan: To check plan information, enter DB Name, User Name, and Password, and then select
.-
Text: You can check plan information in text format.
-
JSON: By viewing the plan information in Json format, you can quickly find the points where bottlenecks occur.
NoteThe function to view plan information in JSON format is supported only in DBX agent 1.6.12 or later.
-
If you select a table or index while viewing the plan information in JSON format, the Object detail window appears where you can see the configurations for columns and index items in the table.
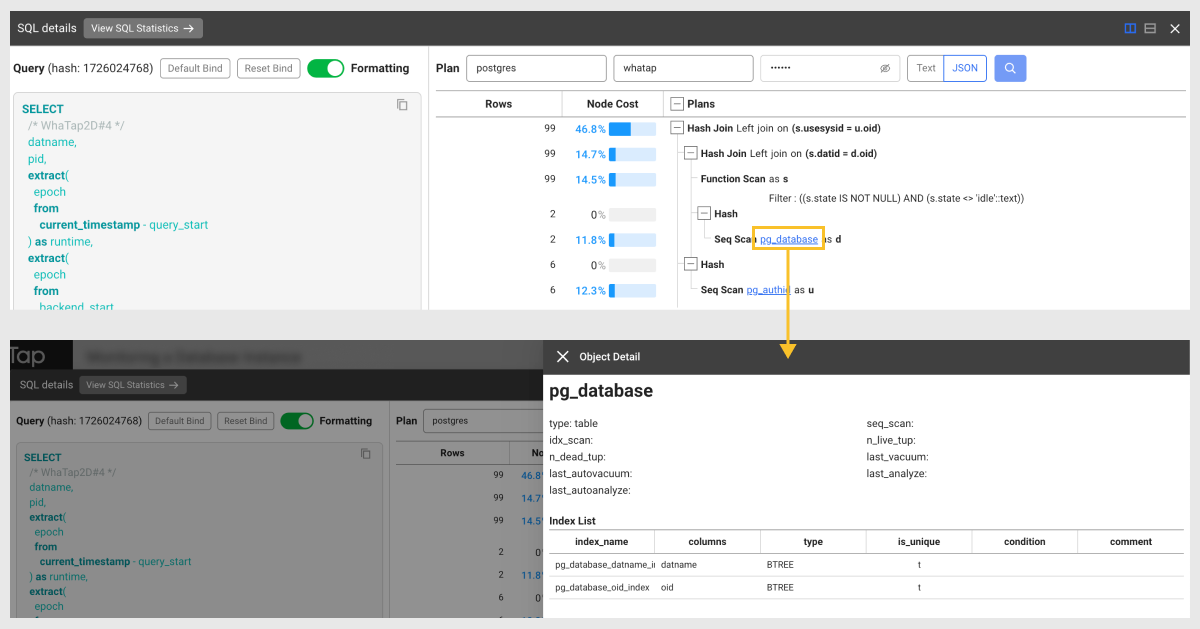
This function is supported in DBX agent 1.6.15 or later. For more information about the database roles and related settings, see the following.
Filtering the searched results
Adding the filter conditions
-
In the Filter option, select
 .
. -
In Filter key, select a desired filtering criteria.
-
If the value of the selected item is text, you can select any of Includes (blue) and Excludes (red).
-
If the value of the selected item is number, you can select any condition of
==(equal to),>=(greater than or equal to), and<=(less than or equal to).
-
-
In Condition, select a condition.
-
Enter a string or number to match the condition.
-
Select Apply.
-
To add filtering conditions, select Add and then repeat Step 1 to 5. Added conditions are applied based on AND (
&&). -
To delete some items while adding conditions, select
 on the right of the filter conditions. To delete all conditions, select Delete All.
 -
To quickly delete the conditions applied to the Filter option, select
 .
.
Modifying the filter conditions
Click any applied to the Filter option. If the Edit filter window appears, modify any desired items and then select Apply.
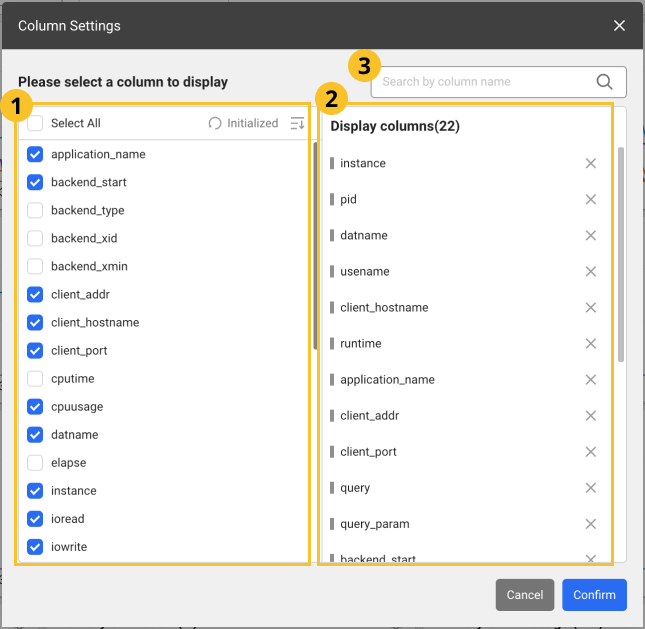
Setting the table columns
You can hide the table header columns or add any of them. You can also change the column order. Select ![]() .
.
-
After configuration, select Confirm to apply the settings in the table.
-
In the
 search bar, enter text to search the desired columns. Only the columns that meet the entered text are displayed.
 -
Images may differ depending on the product, project, or menu.
Adding columns
From the ![]() list, select the items to add as table header columns. To select all items, select Select All.
list, select the items to add as table header columns. To select all items, select Select All.
Deleting columns
From the ![]() list, unselect the columns to delete. Alternatively, select
list, unselect the columns to delete. Alternatively, select ![]() on the right of the item to delete from the
on the right of the item to delete from the ![]() list.
list.
Changing the column order
Drag an item to reposition from the ![]() list, and then move it to the desired position.
list, and then move it to the desired position.
Initializing the configuration
To cancel all changes and reset them, select ![]() Initialized.
Initialized.