Metrics
What is the metrics?
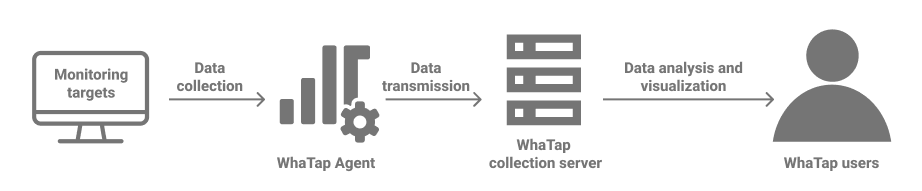
WhaTap collects data from monitoring targets and provides them to users. The data collected from agents is called metrics.
Metrics consists of the following components:
- Category: A group of related metrics
- Tags: Data containing unique identifiers to find the targets to collect
- Fields: Metrics collected from the agent
- Time: Time when the metric has been collected
- Oid: Unique number of the agent that has collected metrics
To view collected data, select a project on the Home screen, and then select Sitemap > Metrics Search.
For example, select a category named db_postgresql_counter and view the related metrics. You can see the (tags) and (fields) that correspond to the category as follows.

Viewing and visualizing the metrics data
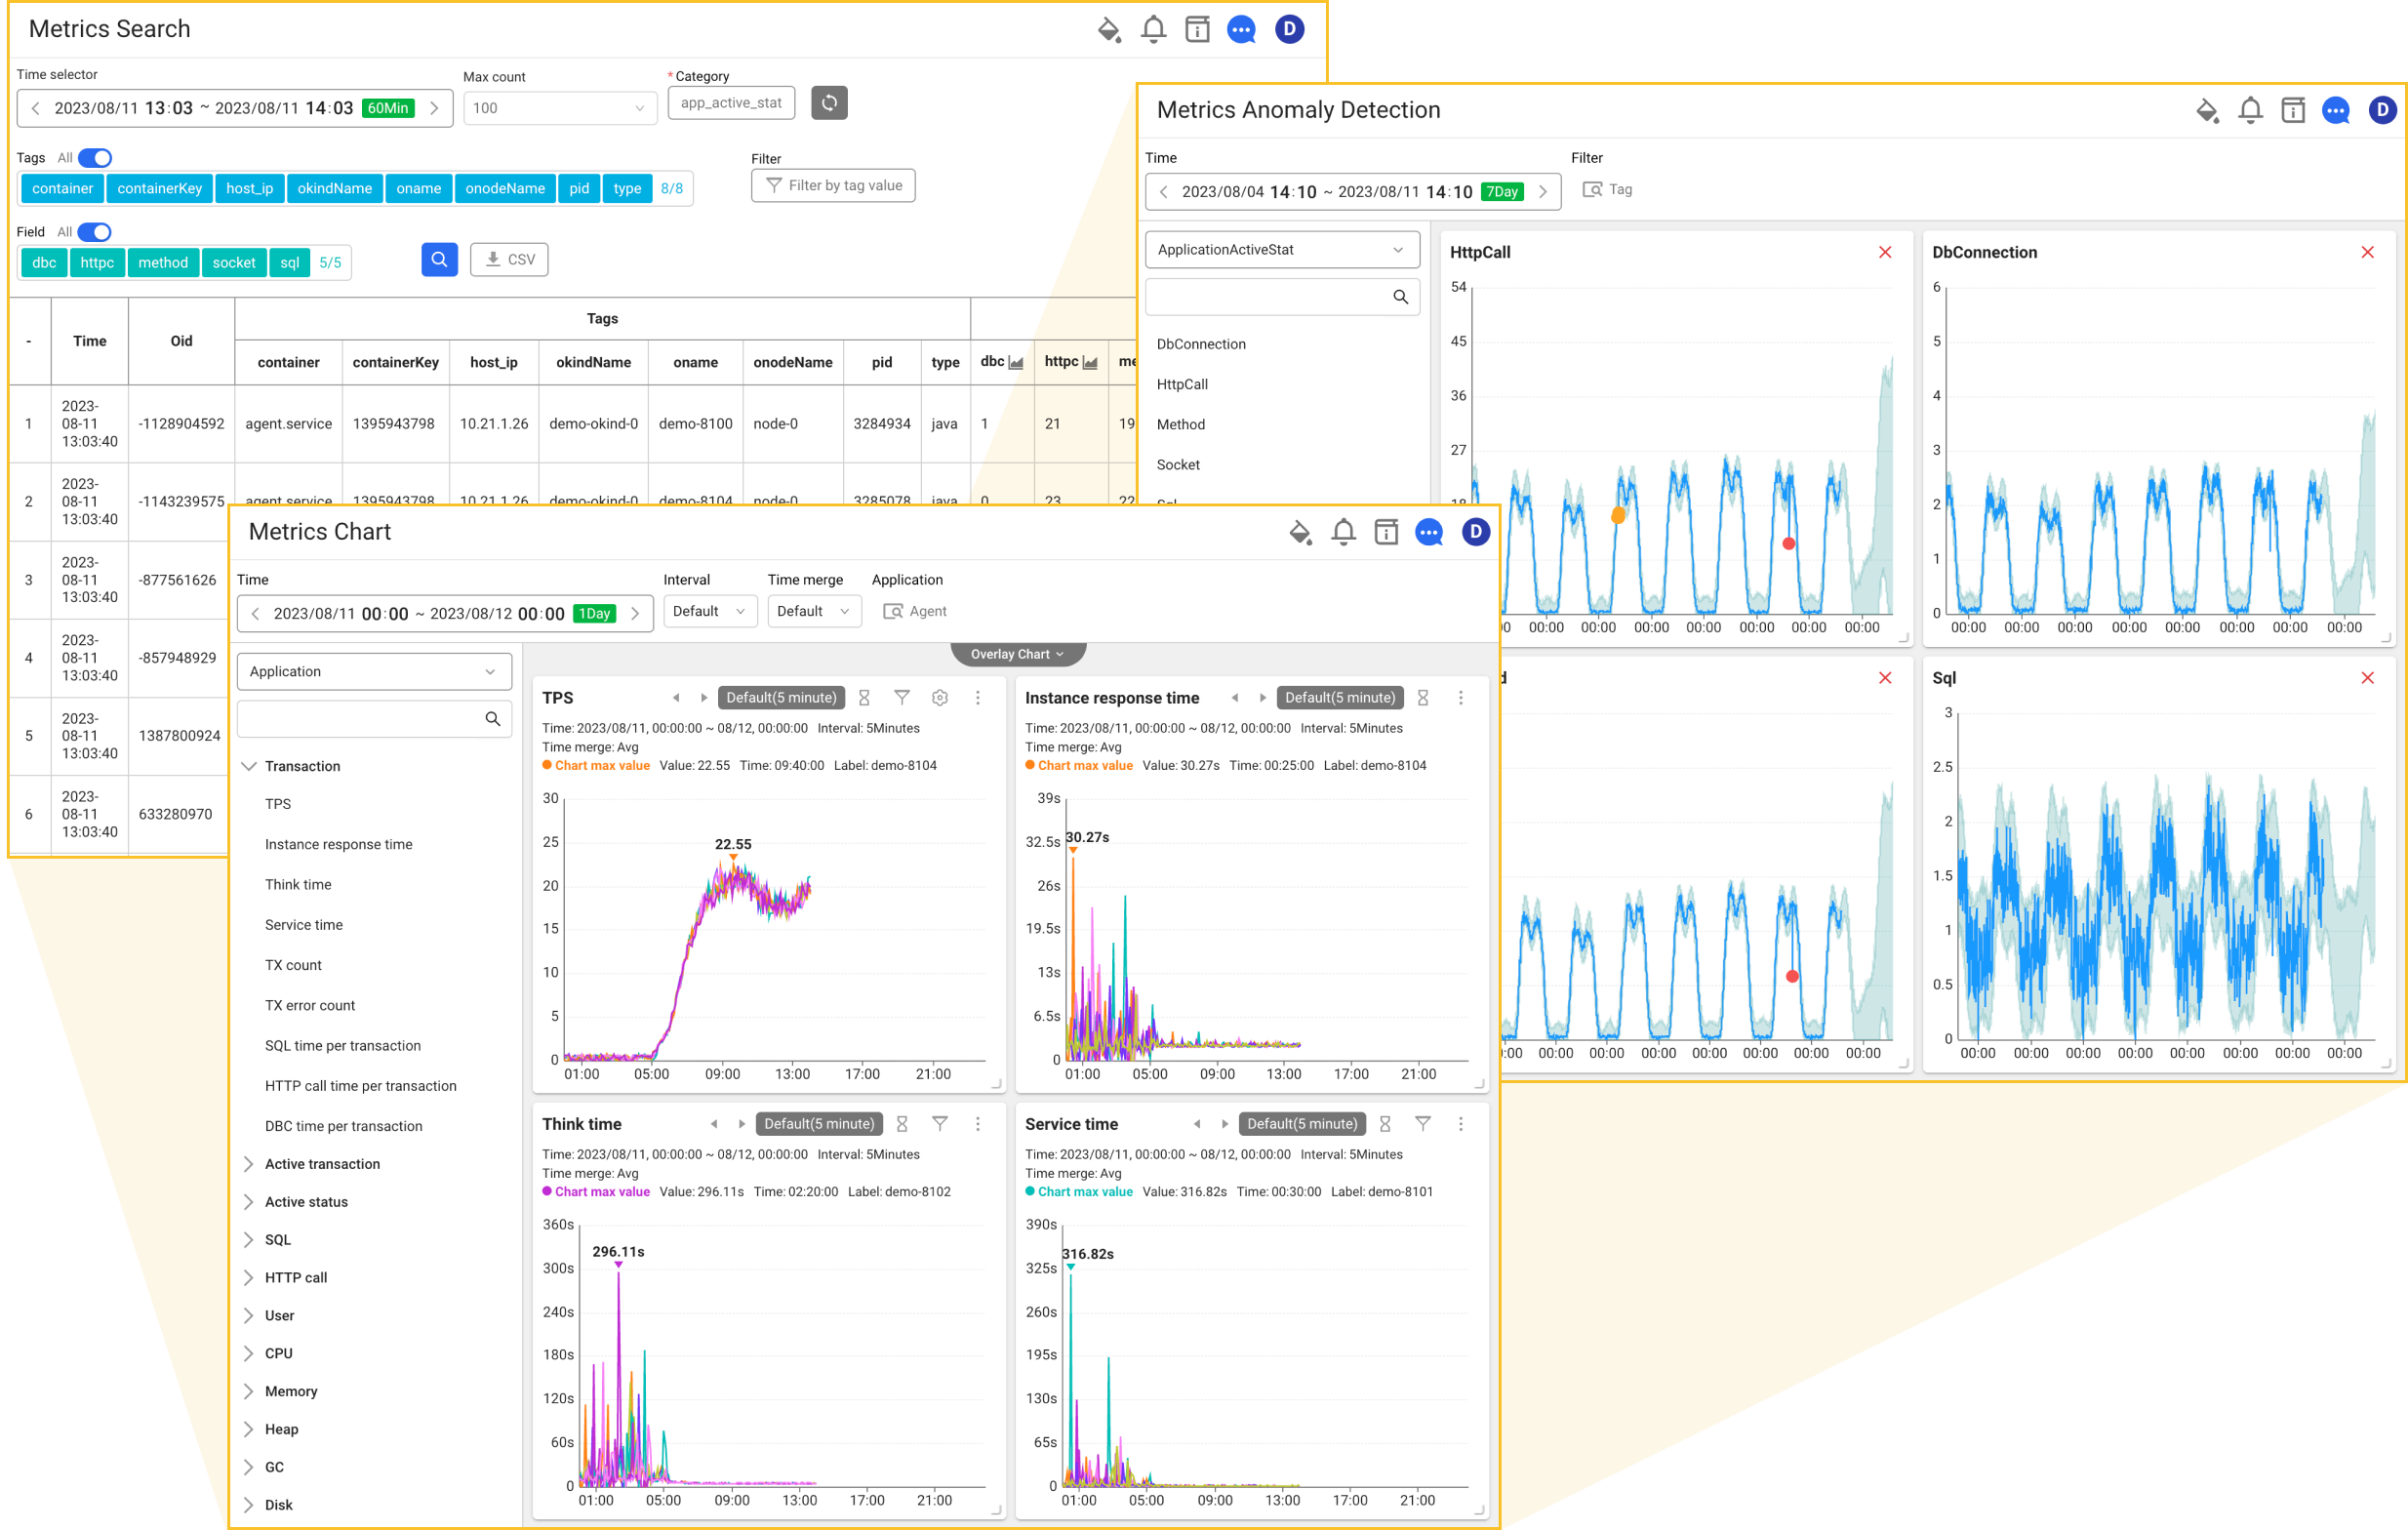
WhaTap provides a list of original data collected according to the conditions specified by user and various charts visualized for convenience as follows. See the menus such as Metrics Search that can look up the original data of metrics, Metrics Chart that can look up metrics data through visualized charts, and Metrics Anomaly Detection that can detect out-of-pattern anomalies by comparing with the patterns of metrics learned by AI.