Database size
Home > Select Project > Stat/Report > DB size
It aggregates the sizes of tables for each database and provides trend data in a chart. You can identify and manage the trend in database capacity growth. You can prepare for rapid capacity increases by identifying them in advance.
Database size can affect the performance. You can prepare to troubleshoot performance issues because the increase in size can delay the query execution. It is also required to identify and prevent problems in advance that may increase the size due to incorrect queries or database structure issues.
The trend in database size helps you understand usage patterns and data growth. You can predict future capacity requirements and take possible actions. Monitoring these changes helps you optimize the resources and costs.
The total database size is queried with the pg_database_size function, and the monitoring account must have the connect or pg_read_all_stats role. template database is excluded from collection.
Individual table sizes can be queried with the pg_relation_size, pg_indexes_size, and pg_total_relation_size functions, and the query role for the corresponding schema is required.
grant pg_read_all_stats to whatap;
grant usage on schema {schema_name} to whatap;
-
The sizes for the
pg_catalog,sys,information_schema, andpg_toastschemata are not collected. -
The collection cycle is collected once every hour.
Basic screen guide
-
Set the time to search in Time. You can also select a lookup time by clicking the green button.
-
Select a target to view in Instance.
-
Select
 .
.
-
The lookup time can be set up to 62 days. In case of a view for 3 days or more, the graph displays the daily average.
-
For more information on how to use the Time option, see the following.
Checking the changes over time
-
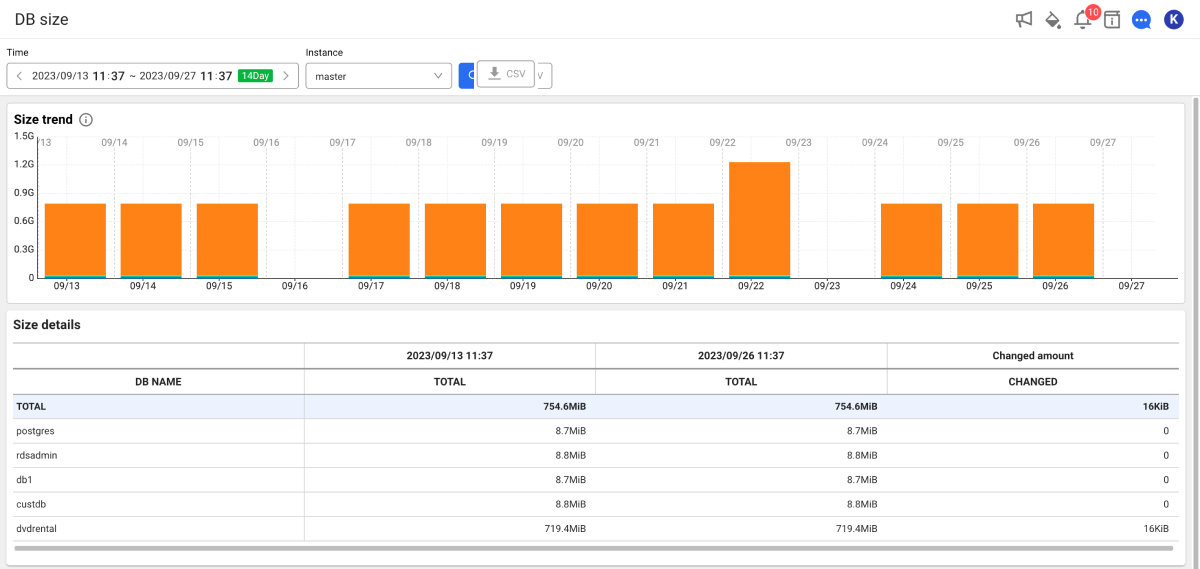
Size trend
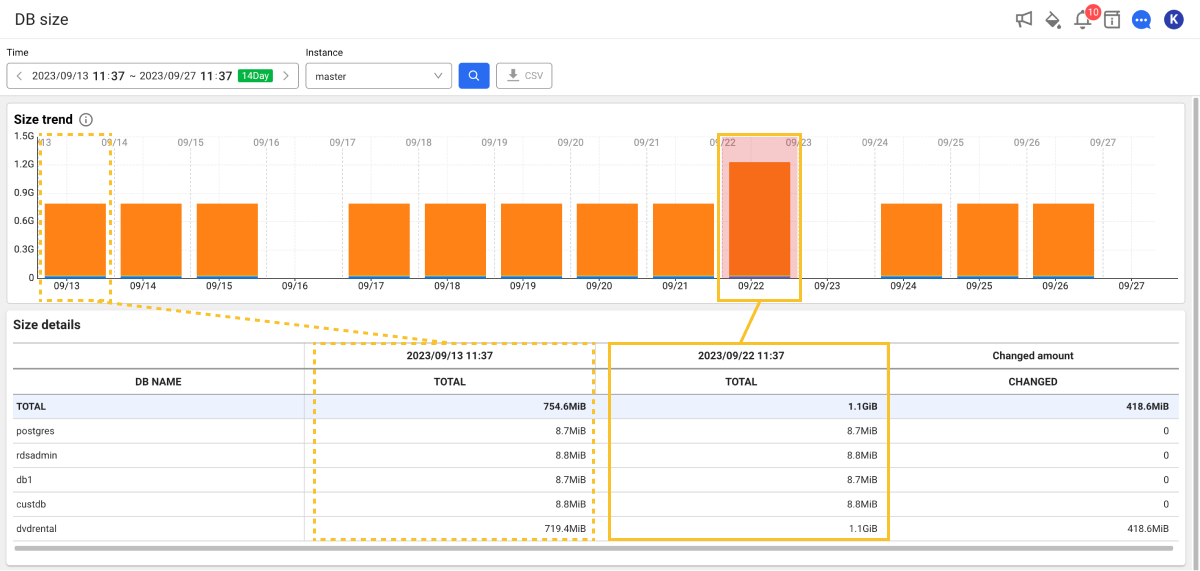
You can visually see the changes in the total size and usage of the database over time. The chart displays the sizes for each database in different color. Hover your mouse over the chart and move it left and right to view the details. You can see information details on the sizes for each database at a specific time point through the tooltip.
-
Size details
It provides capacity details for each database in a table format. You can check the names (DB NAME) for each database, total capacity (TOTAL), and changed amount (CHANGED). If you select a database, you can see information details in the Table size (TOP 50) section.
Checking the sizes for each table
If you select a database in the Size details section, you can check the list of sizes for each table corresponding to the top 50 sizes in the database.
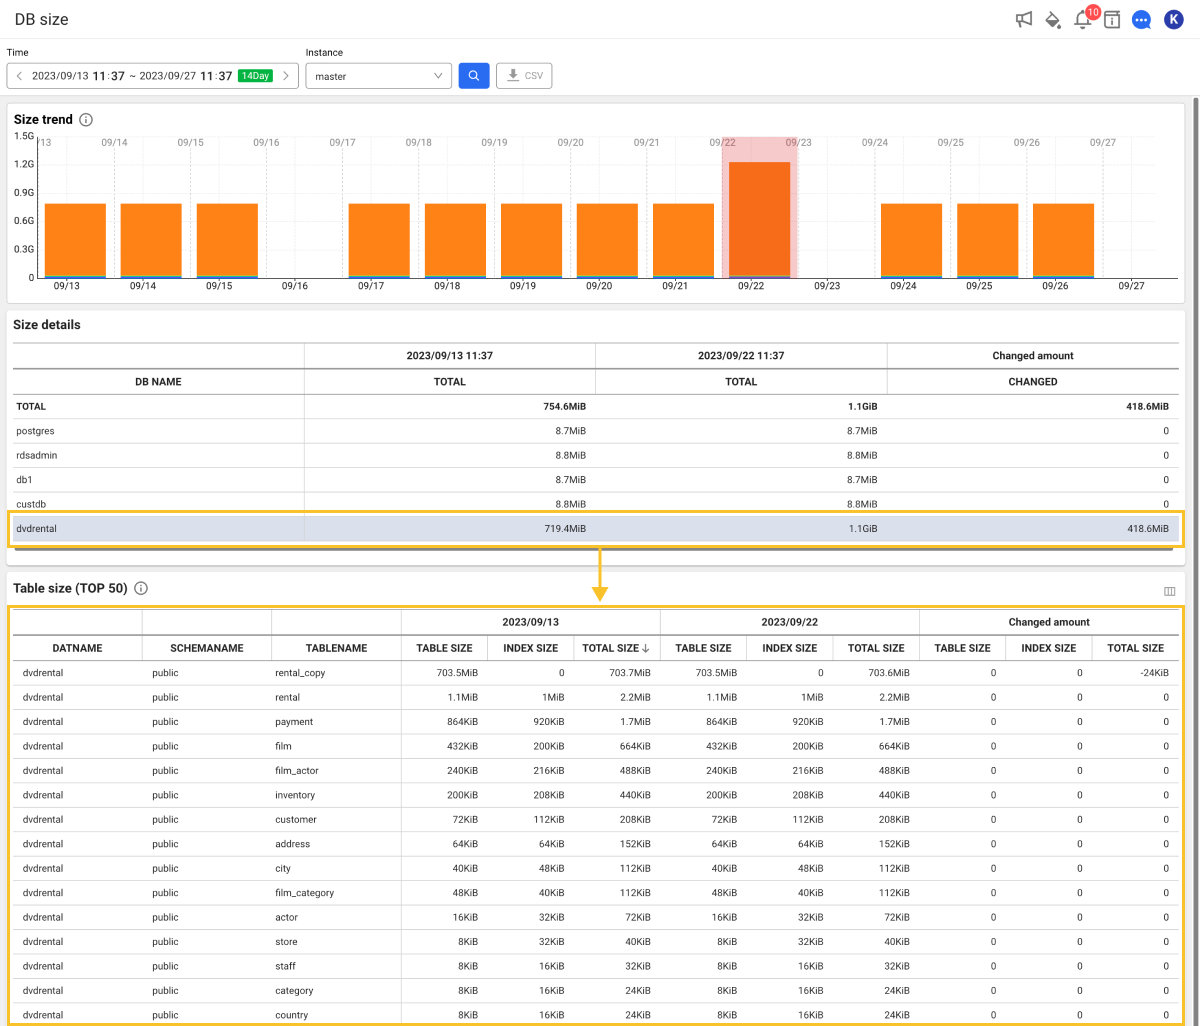
You can query the schema name (SCHEMANAME), table name (TABLENAME), table size (TABLE SIZE), index size (INDEX SIZE), and total capacity (TOTAL SIZE) for each table in the database. You can check the changes in the start time and end time for the query. This allows you to easily detect large tables and supports management efforts for capacity optimization.
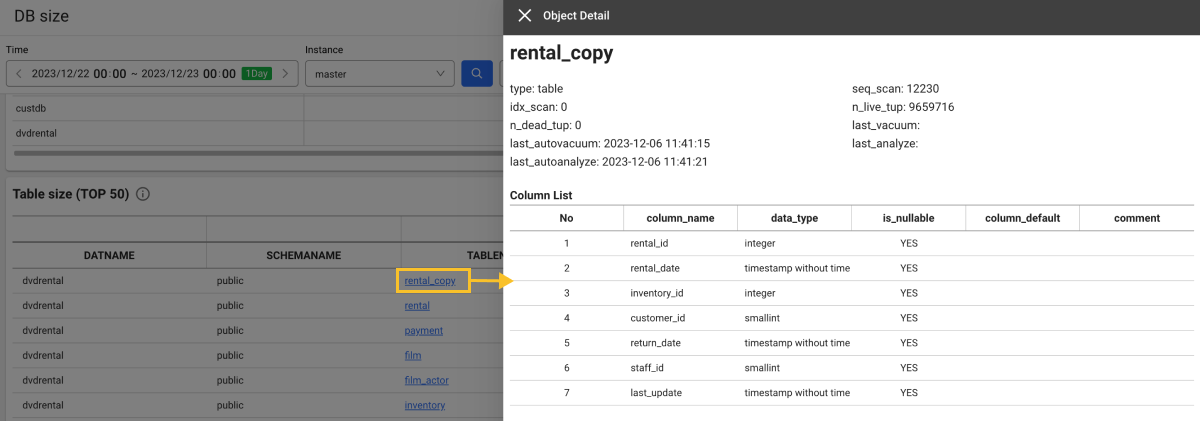
When you select the TABLENAME column in the table list of the Table size (TOP 50) section, the Object Detail window appears, where you can check the configuration of column and index.
- This function is supported in DBX agent 1.6.15 or later. For more information about the database roles and related settings, see the following.
- To change the order of table columns or hide specific columns in the Table size (TOP 50) section, select
 on the upper right. For more information about the column configuration, see the following.
Downloading the viewed data
You can download the searched data as a CSV format file. Select ![]() and then select Size details or Table size (TOP 50).
and then select Size details or Table size (TOP 50).