Wait analysis
Home > Select Project > Analysis > Wait Analysis
You can check in which wait event the active session is waiting and which wait events occur frequently. Active sessions collected every 5 seconds can be analyzed from the wait perspective.
-
This function is supported in DBX agent 1.6.10 or later.
-
The collected wait data includes
wait_eventandwait_event_typein thepg_stat_activityview. For more information about the metric, see the following.
Basic screen guide
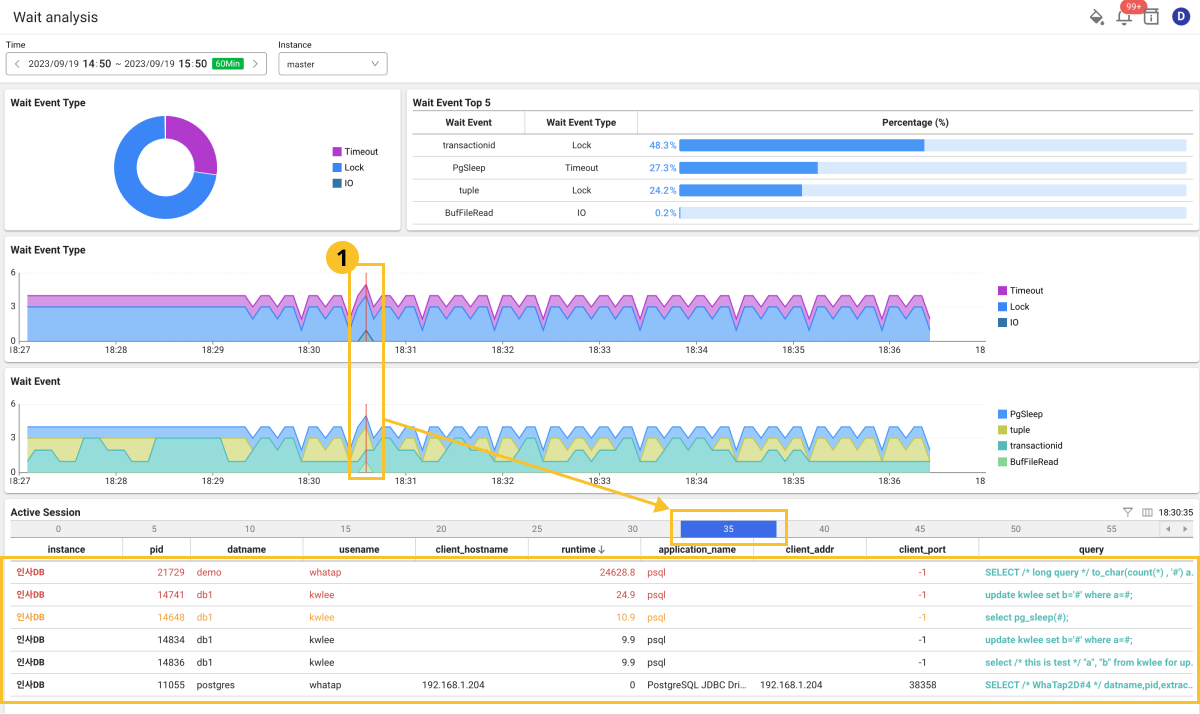
Select the Time and Instance to view. You can see the wait data corresponding to the set time and instance. If there are active sessions that frequently wait (delay) during the query period, it can be used to analyze what types of wait events occurred.
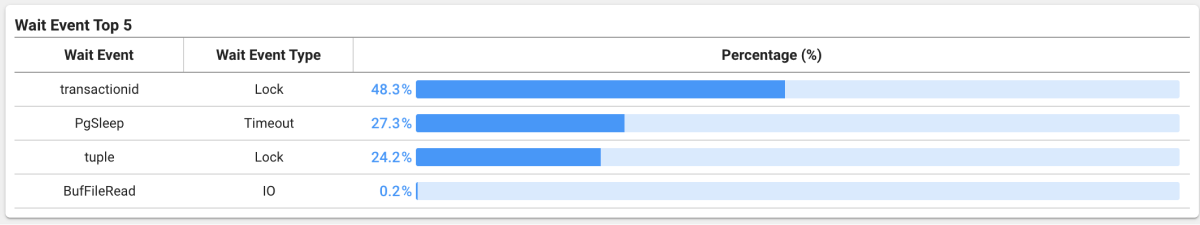
In Wait Event Top 5, you can see which wait events occurred most frequently. Using the above image as an example, the most frequently occurred type of wait event is Lock. If you select the ![]() detailed time in the graph chart, you can view the active sessions in the time and check the SQL statements in which the wait events occurred.
detailed time in the graph chart, you can view the active sessions in the time and check the SQL statements in which the wait events occurred.
-
When you select the instance column in the Active Session section list, the Monitoring a Database Instance menu appears. For more information about Monitoring a Database Instance, see the following.
-
In the Active Session list, if you select a session, the Session detail window appears. For more information about the Session detail windows, see the following.
-
When you select the query column in the Active Session list, the SQL details window appears. For more information about the SQL details windows, see the following.
-
For more information on how to use the Time option, see the following.
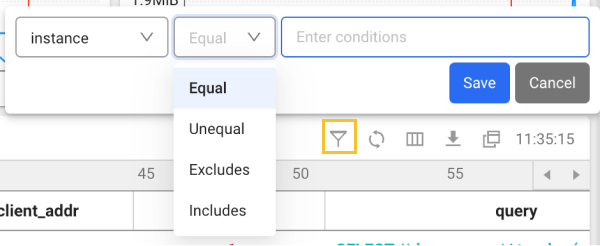
Filtering the table data
-
Select
 on the upper right of the table.
 -
Select a column header and a condition in the table.
-
Enter a desired value in the Enter conditions field.
-
Select Save.
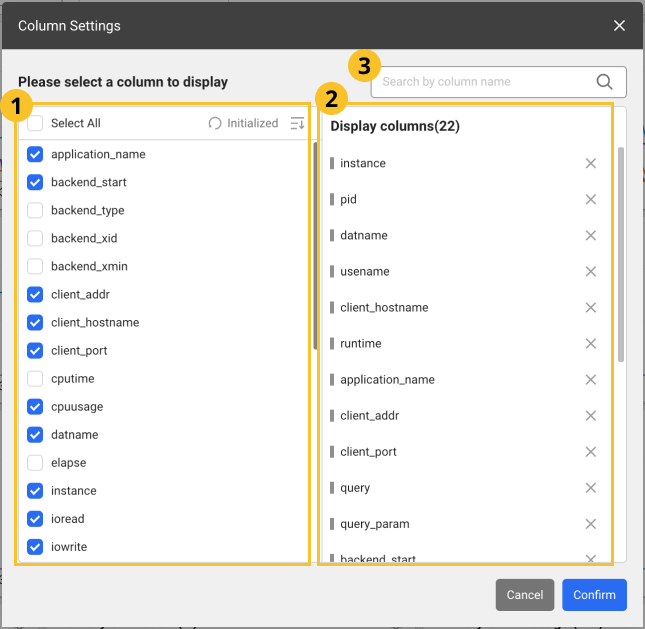
Setting the table columns
You can hide the table header columns or add any of them. You can also change the column order. Select ![]() .
.
-
After configuration, select Confirm to apply the settings in the table.
-
In the
 search bar, enter text to search the desired columns. Only the columns that meet the entered text are displayed.
 -
Images may differ depending on the product, project, or menu.
Adding columns
From the ![]() list, select the items to add as table header columns. To select all items, select Select All.
list, select the items to add as table header columns. To select all items, select Select All.
Deleting columns
From the ![]() list, unselect the columns to delete. Alternatively, select
list, unselect the columns to delete. Alternatively, select ![]() on the right of the item to delete from the
on the right of the item to delete from the ![]() list.
list.
Changing the column order
Drag an item to reposition from the ![]() list, and then move it to the desired position.
list, and then move it to the desired position.
Initializing the configuration
To cancel all changes and reset them, select ![]() Initialized.
Initialized.