Top Object
Home > Select Project > Analysis > Top Object
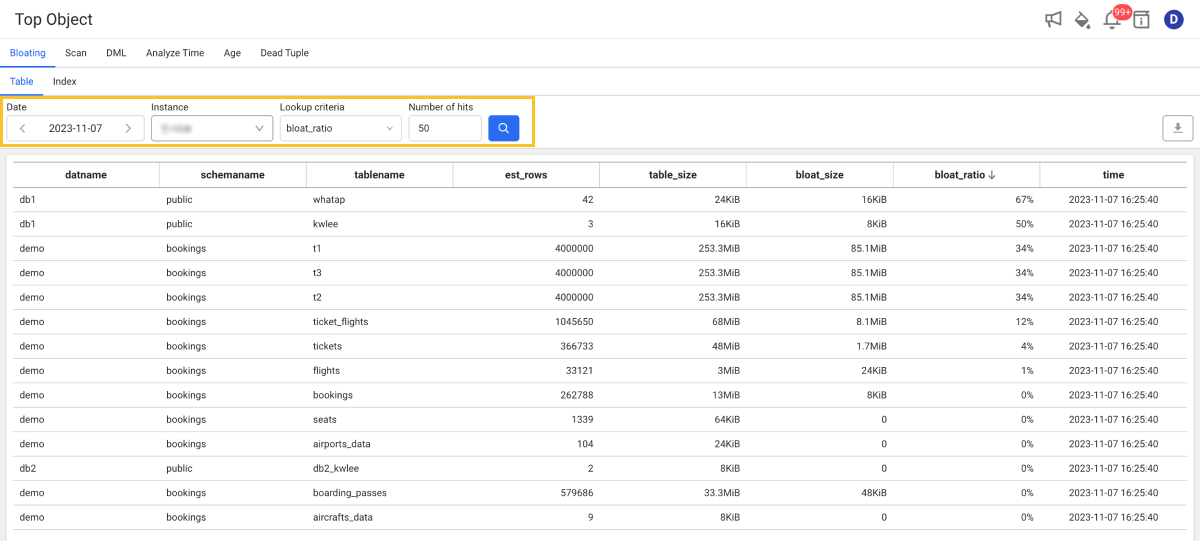
It provides objects with the bloating size, scan count, DML execution count, and objects with many dead tuples for each object (table, index) of individual instance, and provides information to identify objects that are used a lot and perform Vacuum or Analyze at appropriate times.

-
Set Date, Instance, Lookup criteria, and Number of hits to view on the screen and then select
. The results for the selected conditions appear in the table.
-
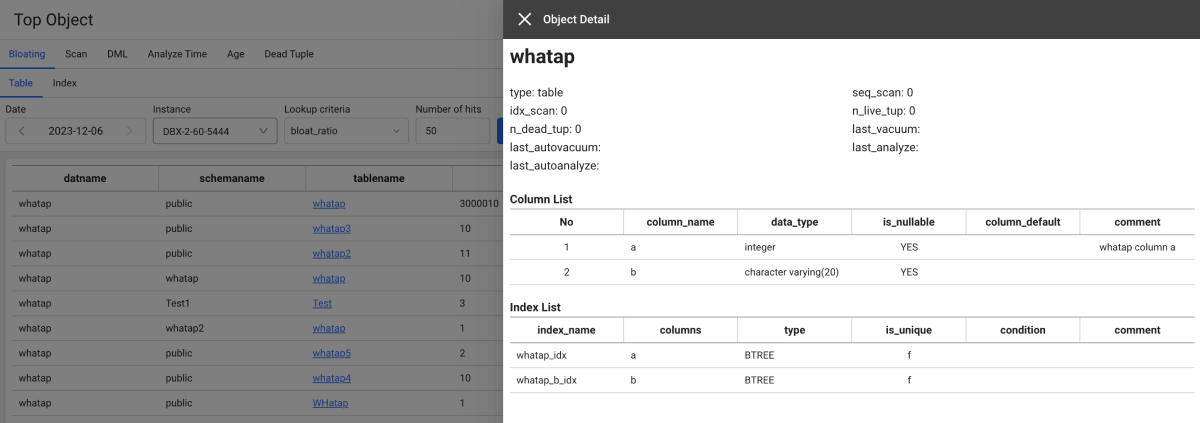
If you select the tablename or indexname column in the inquiry list, the Object detail window appears where you can see the configuration for column and index.
 Note
NoteObject detail is provided in the DBX agent 1.6.15 or later. For more information about the database roles and related settings, see the following.
-
The Top Object data is collected once a day. For more information about the related agent settings, see the following.
-
To view data, the DB monitoring account requires the following roles:
grant select on all tables in schema {schema_name} to whatap; -
This function is supported in DBX agent 1.6.13 or later.
Bloating
Bloating is a phenomenon in which the object size increases due to an increase of unused tuples.
Tables and indexes with the values greater than the collection reference set in table[index]_bloat_ratio[bytes] in the agent configuration (whatap.conf), appear in the list. If there is no corresponding object, data may not be viewed.
Tuning tips
For tables with higher Bloat_ratio, consider performing the Vacuum operation. For more information, see the following document.
If Bloating is viewed, the following columns are displayed.
| Type | Column name | Description |
|---|---|---|
| Table | datname | Database name |
schemaname | Schema name | |
tablename | Table Name | |
est_rows | Value predicted by the number of Dead tuple + Live tuple | |
table_size | Table size | |
bloat_size | Expected table size inflated by Dead tuple | |
bloat_ratio | Inflated size ratio. | |
| Index | datname | Database name |
schemaname | Schema name | |
tablename | Table Name | |
indexname | Index name | |
table_size | Table size | |
index_size | Index size | |
bloat_size | Expected index size inflated by Dead tuple | |
bloat_ratio | Inflated size ratio. | |
index_scans | Number of index scans when using indexes |
Scan
Seq_scan means the full scan without using indexes, and idx_scan means the number of index uses.
Tuning tips
Consider creating indexes for tables with higher Seq_scan and deleting indexes with lower idx_scan. For more information, see the following.
If Scan is viewed, the following columns are displayed.
| Type | Column name | Description |
|---|---|---|
| Table | datname | Database name |
schemaname | Schema name | |
tablename | Table Name | |
seq_scan | Number of sequential scans (full scans) of the table | |
seq_tup_read | Number of live rows from sequential scans | |
idx_scan | Number of index scans for the table | |
idx_tup_fetch | Number of live rows read by index scan | |
| Index | datname | Database name |
schemaname | Schema name | |
tablename | Table Name | |
indexname | Index name | |
idx_scan | Number of index scans | |
idx_tup_fetch | Number of valid table rows extracted from index scans using indexes | |
idx_tup_read | Number of index items returned by index scan |
DML
Tables with higher dml_count values are frequently used tables.
Tuning tips
Identify the main tables in your system and then use them as references when changing tables or designing the architecture.
If DML is viewed, the following columns are displayed.
| Column name | Description |
|---|---|
datname | Database name |
schemaname | Schema name |
tablename | Table Name |
dml_count | n_tup_ins + n_tup_upd + n_tup_del |
n_tup_ins | Number of inserted lines |
n_tup_upd | Number of updated lines |
n_tup_del | Number of deleted lines |
n_tup_hot_upd | Number of hot updated lines (e.g. no separate index update required) |
Analyze Time
This list includes objects for which Analyze and Vacuum operations have become outdated.
Tuning tips
Older tables may have inaccurate statistical information. Review the operations. For more information, see the following.
If Analyze Time is viewed, the following columns are displayed.
| Column name | Description |
|---|---|
datname | Database name |
schemaname | Schema name |
tablename | Table Name |
last_analyze | Last time of manual table analysis |
last_autoanalyze | Last time of table analysis by the autovacuum daemon |
last_autovacuum | Last time of table cleanup (vacuum) by the autovacuum daemon |
analyze_count | Number of manual analyses |
last_vacuum | Last time of table vacuumed manually (VACUUM FULL not applicable) |
autoanalyze_count | Number of analyses by the autovacuum daemon |
autovacuum_count | Number of cleanups (vacuum) by the autovacuum daemon |
vacuum_count | Number of manual cleanups (vacuum) (VACUUM FULL excluded) |
n_mod_since_analyze | Number of lines changed since last analysis (analyze) |
Age
In PostgreSQL, XID (transaction id) is used recursively so that the XID may wrap around at a certain point. To prevent this, xid_age (Current XID - XID at the time of creation) must be managed so that it does not keep increasing. If autovacuum_freeze_max_age exceeds, Anti-Wraparound Vacuum is automatically performed and xid_age is managed below autovacuum_freeze_max_age.
This list displays vacuum targets that meet the following criteria: If there is no target, data may not be viewed.
-
Table with dead tuples more than vacuum threshold (
autovacuum_threshold+autovacuum_scale_factor*number-of-tuples). -
Table with the age (
relfrozenxid) greater thanautovacuum_freeze_max_age
Tuning tips
If xid_age continues to increase, XID cleaning may not be performed under the set Auto Vaccum condition. Adjust the auto vacuum parameters or review the vacuum execution manually.
For more information, see the following.
If Age is viewed, the following columns are displayed.
| Column name | Description |
|---|---|
datname | Database name |
schemaname | Schema name |
tablename | Table Name |
xid_age | Max age of the table, xid (transaction ID) of the oldest record |
per_to_wraparound | Metric that displays the remaining margin up to the xid (transaction ID) wrapping as a percentage. Formula: per_to_wraparound(%) = xid_age / Autovacuum_freeze_max_age * 100 |
table_size | Table size |
autovacuum_vacuum_tuples | If the number of dead tuples exceeds this value, autovacuum is performed. |
dead_tuples | Number of dead tuples |
autovacuum_freeze_max_age | The default value is set to 200 million. |
Dead Tuple
Dead tuple is the data that has already been deleted using Delete or Update. Review the Vacuum operation to change to free space.
Tuning tips
To reduce dead tuples, review the Vacuum operation. For more information, see the following.
If Dead Tube is viewed, the following columns are displayed.
| Column name | Description |
|---|---|
datname | Database name |
schemaname | Schema name |
tablename | Table Name |
dead_tuple | Number of unused tuples due to Delete or Update |
dead_tuple_ratio | Proportion of unused tuples |
live_tuple | Number of unused tuples |
live_tuple_ratio | Proportion of used tuples |
total_relation_size | Total size of relation including the index and TOAST data |
total_tuple | Number of all tuples |
Agent setting
The following is the agent setting to view Top Object information. Check the options required in whatap.conf.
-
pg_object Boolean
Default
falseSet whether or not to collect data from the Top object. To collect data, change it to
true. -
pg_object_hour Int
Default
5Set the time to collect data from the Top object. The default value is
5and collection starts at 5 AM. -
table_bloat_ratio Percentage
Default
50Data is collected when the table's bloating ratio is greater than the set value. The default value is 50%.
-
table_bloat_bytes Byte
Default
10485760Data is collected when the table's bloating bytes is greater than the set value. The default value is 10 MB.
-
index_bloat_ratio Percentage
Default
50Data is collected when the index's bloating ratio is greater than the set value. The default value is 50%.
-
index_bloat_bytes Byte
Default
10485760Data is collected when the index's bloating bytes is greater than the set value. The default value is 10 MB.
-
autovacuum_list_limit Int
Default
50Table data is collected according to the set value from the oldest age (
relfrozenxid). The default value is 50.