Lock tree
Home > Select Project > Analysis > Lock Tree
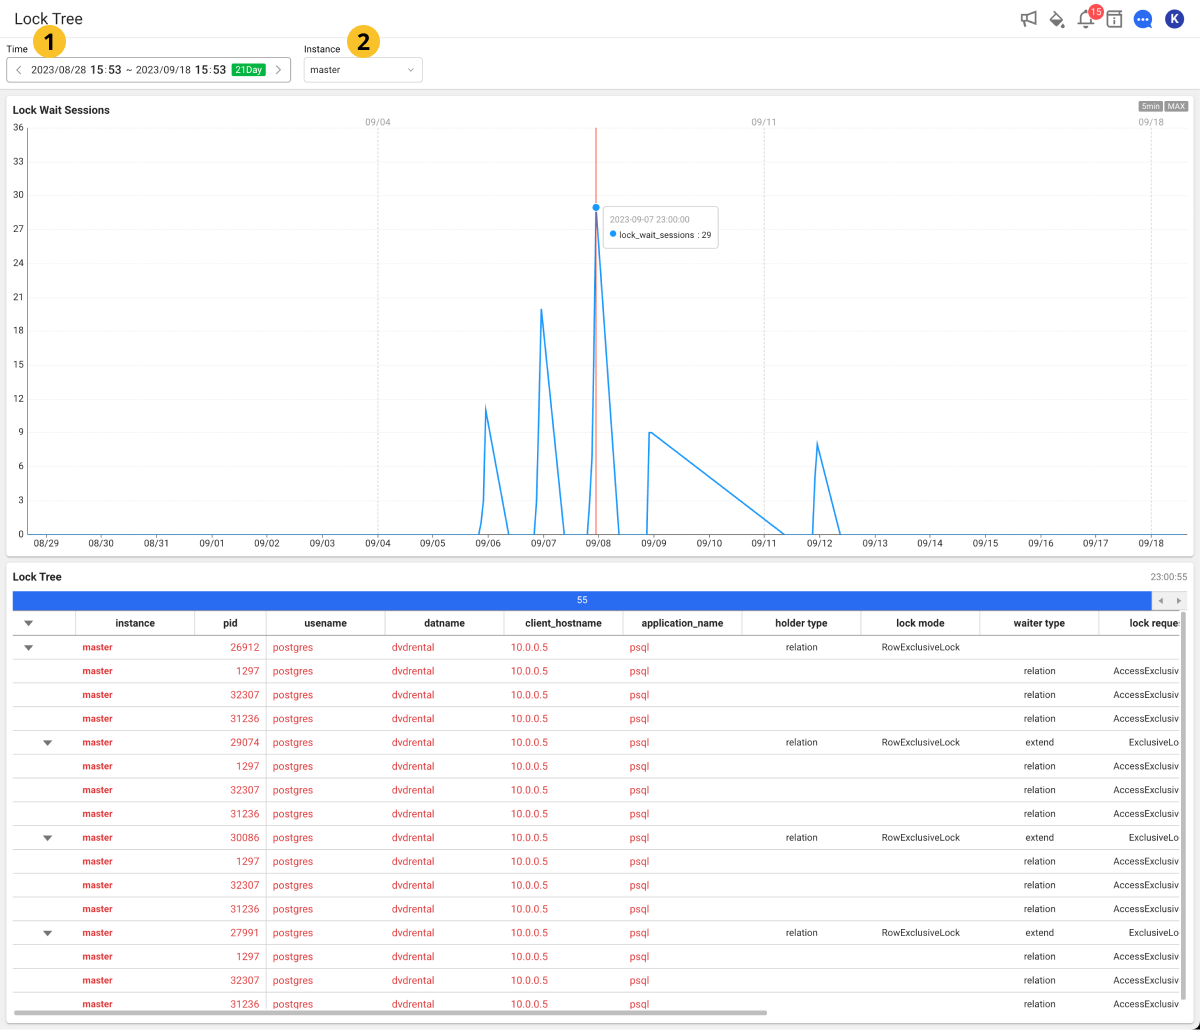
This tool analyzes the trend of locks that occurred during the day. This function allows you to visually check the tree structure of the session that generated the lock (lock holder) and the session waiting for the lock (lock waiter). You can analyze the relationship between the holder and waiter of the lock that occurred at a specific time point.
Key features are as follows:
-
Lock trend analysis: The trends of locks that occurred during the set search period are traced over time and displayed in a graph. This allows you to visually check how the locks are created and resolved.
-
Check lock holder and waiter: You can see the holder and waiter for each lock in a tree structure. Through this, when a specific lock occurs, you can check the relationship between the session that generated the lock and the waiting session.
-
Inter-session relationship analysis: By analyzing the relationship between the session that generated the lock and the waiting session, you can identify the cause of the lock that occurred during the query execution and transaction handling.
This allows the database administrator to quickly identify and resolve lock-related issues and optimize the database performance.
Basic usage guide
Select the desired date, time, and instance to view in ![]() Time and
Time and ![]() Instance. If a lock occurs at the set time, the searched data appears in Lock Wait Sessions and the Lock Tree table at the bottom of the screen.
Instance. If a lock occurs at the set time, the searched data appears in Lock Wait Sessions and the Lock Tree table at the bottom of the screen.
-
You can see the data for up to two weeks within a chart. If you click a specific time in the graph chart, you can check the lock information for the selected time in the table at the bottom of the screen. If you select the button in seconds, you can view the lock information in 5-second increments.
NoteThrough the tags on the upper right of the Lock Wait Sessions chart, you can see the units to view.
-
As you continuously drag (drill down) a specific time zone on the graph chart, you can see the charts and lock trees for detailed time zones.
-
You can see the data in 5-second increments by dragging within 3 hours on the chart. However, the data in 5-second increments can only be viewed within the most recent month. The data earlier than one month can only be viewed as 5-minute summary data. For example, you can drag (drill down) lock tree data from 40 days ago for the 5-minute summary data, but you cannot see 5-second data.
Column information guide
- Active session
- Lock tree
- Process information
| Item | Description |
|---|---|
pid | Process ID |
db | Database name |
user | SQL execution account |
application | Client application name |
client_host | Host name of the connected client (reported by reverse DNS lookup of client_addr) |
client_addr | Client IP address |
client_port | Client port number (in case of using the UNIX socket -1) |
query_hash | Hash value of query (internal WhaTap control value) |
query_start | Time when the active query started (if the state is not active, it is the last query started time) |
state | Current status of the backend process (active, idle, etc.) |
state_change | Last time when the state was changed |
xact_start | Time when the current transaction for the process started (null if no transaction is active) |
backend_start | Time when the backend process started |
backend_xmin | Minimum value of xid whose backend process is being processed |
backend_type | Type of the backend process (e.g. autovacuum worker, logical replication launcher, client backend, checkpointer) |
backend_xid | xid whose backend is being processed |
wait_event_type | Type of the event whose backend process is in standby |
wait_event | Waiting event name where the backend process is in standby |
WhaTap basically stores the client-related information.
| Item | Description |
|---|---|
holder type | Type of the holder session (transaction ID, tuple, etc.) |
lock mode | holder_mode (exclusive lock, shared lock, etc.) |
waiter type | Type of the waiter session (transaction ID, tuple, etc.) |
lock request | waiter_mode (exclusive lock, shared lock, etc.) |
The following items are the metrics collected if the XOS agent has been installed.
| Item | Description |
|---|---|
cputime | CPU usage time |
cpuusage | CPU Utilization |
elapse | Elapsed time of CPU usage |
vsize | Virtual memory size (Kb) |
rss | Resident Set Size (RSS) that is the number of physical pages associated with the process. |
state | Process status |
ioread | Actual time spent reading the block (milliseconds) |
iowrite | Actual time spent writing the block (milliseconds) |
pss | Process specific memory usage + Percentage of shared memory occupied by one process |
uid | user id |
cmd | Executing command |
longcmd | Full path of cmd |