Analyzing the transactions
Hitmap
Home > Select Project > Analysis > Hitmap
On the initial screen of the WhaTap Monitoring service, select a project and then click Analysis > Hitmap.
Hitmap can be also accessed through the Hitmap widget in Dashboard > Application Dashboard.
Detailed analysis
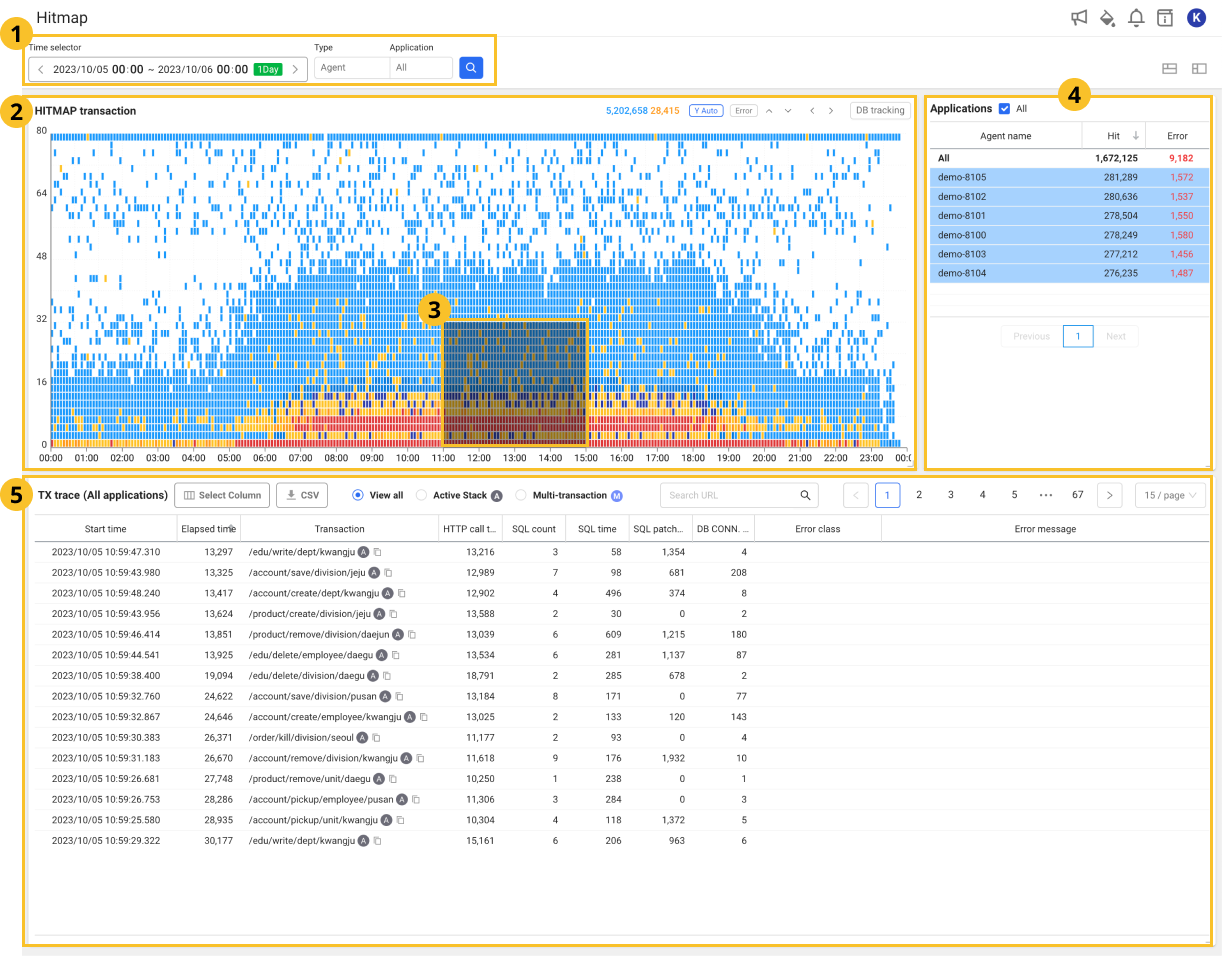
 agent area
You can filter by selecting agents linked with the current project. If you select the ![]() icon, the HITMAP transaction chart can be viewed in the
icon, the HITMAP transaction chart can be viewed in the ![]() area.
area.
 HITMAP transaction
If transactions with latency issues are included, they appear in orange or red on the HITMAP transaction chart. If only normal transactions are included, they appear in blue.
 Selection area
If you drag the real-time hitmap chart, the ![]() TX trace list appears where
TX trace list appears where ![]() Applications list and transaction information can be viewed in the selected area.
Applications list and transaction information can be viewed in the selected area.
 Applications
You can check the numbers of transactions and errors included in the selected area on the chart. If you select the desired application in the list, the information details of the application appear in ![]() TX trace.
TX trace.
 TX trace
The TX trace list contains information details. If you select a desired transaction from the list, the Transaction information window appears. In the Transaction information window, you can see the detailed trace details for the transaction. For more information, see the following.
Understanding the hitmap patterns
The hitmap is a distribution chart whose X-axis is the transaction end time, and Y-axis is the response time. A normal web application displays a distribution concentrated in a few seconds or less.

Analyzing the hitmap lines
-
Vertical line (LOCK symptom) pattern
If a temporary lock (not only DB lock) occurs during transaction processing, the processing is queued. If the lock is released, pending transactions are finished together at a similar time. This creates vertical lines as follows:

Detecting locks in vertical line patterns is a very powerful concept. Especially in the microservice architecture, locks from backend systems can be equally detected.

The vertical lines for response patterns in the front applications are also detected when any lock occurs in the DB used by the back-end system.
-
Horizontal line (timeout) pattern
In the 10-second timeout condition, if the resources are insufficient, the transactions wait for 10 seconds until a timeout error occurs. At this time, horizontal lines appear near 10 seconds of the hitmap as follows:

If there is a logic to retry after timeout, the horizontal lines repeat every 10 seconds as shown in the figure. The following is the hitmap for failures.

(1) The response time increased in the section and (2) the red lines in the section are horizontal line patterns. (1) ConnectionPool is exhausted due to section load, (2) the secondary timeout failure occurred due to insufficient ConnectionPool.
Using the pattern analysis
A line in the transaction response distribution indicates a bottleneck. If the lock is temporary, a vertical line is generated. If the bottleneck is release by timeout, a horizontal line is generated.

When analyzing a problem, you can quickly pinpoint a transaction included in the line for selective analysis.
Analyzing the machine learning based response patterns
This function automatically detects abnormalities after analyzing the hitmap patterns with an aid of machine learning technology and then issues an alert.
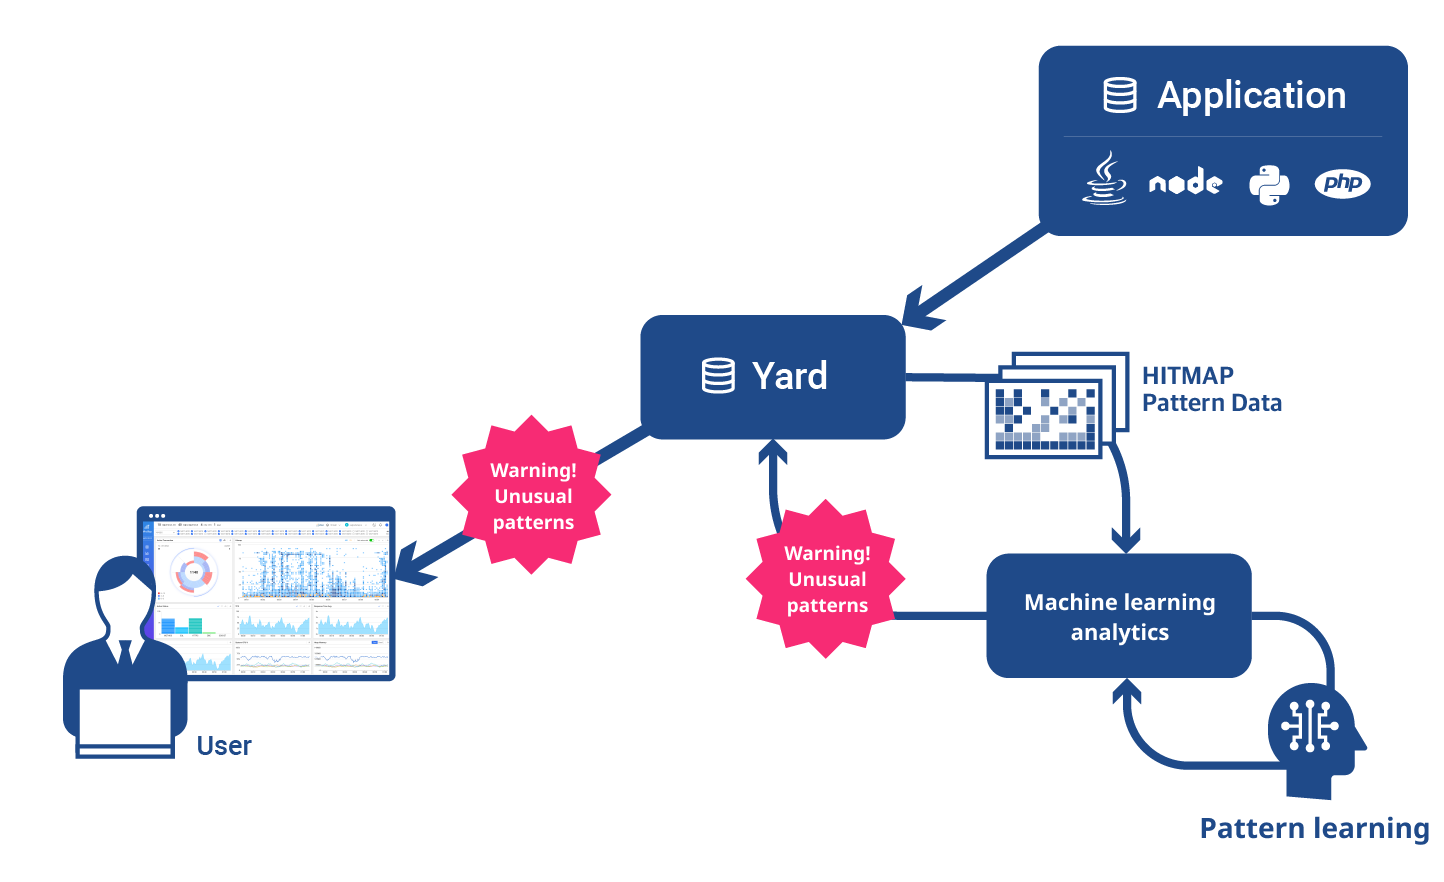
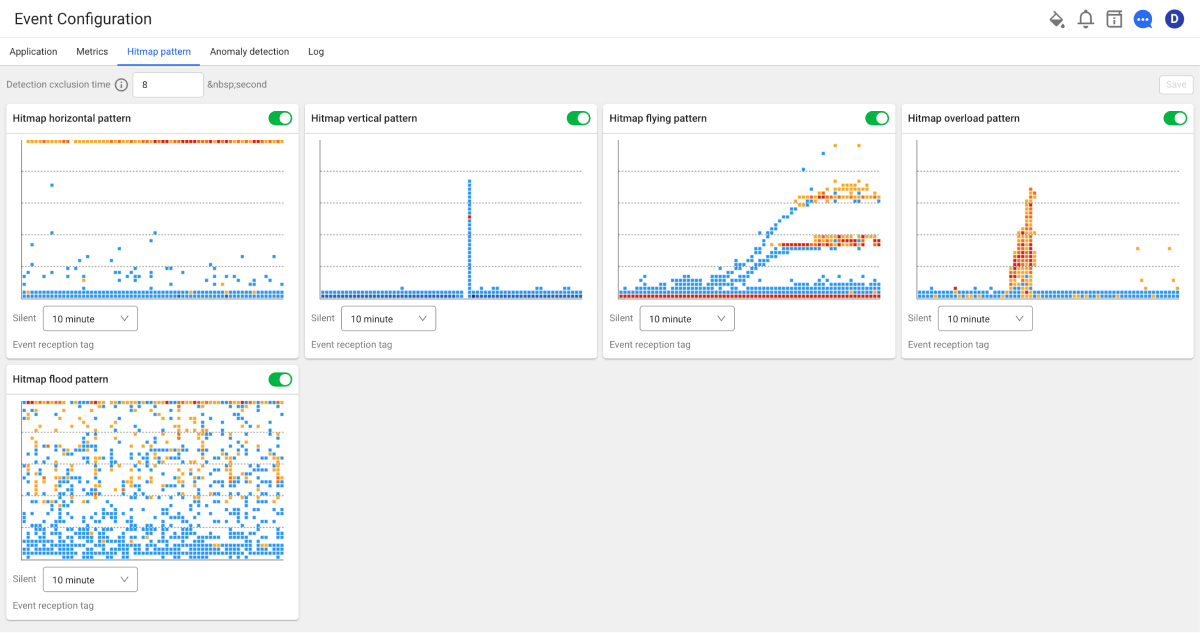
Abnormal pattern example
It learns abnormal patterns from hundreds of TB of performance data every month and issues an alarm when a pattern similar to the learned abnormal one is detected.
-
Vertical line pattern
-
Horizontal line pattern
-
Composite pattern
-
Hitmap alarm
For more information about the analysis method of the HITMAP transaction chart, see the following.