Metric Anomaly Detection
Home > Select Project >![]() Sitemap> Metrics Anomaly Detection
Sitemap> Metrics Anomaly Detection
You can compare the patterns of various metrics with the expected patterns learned by the AI. Anomaly detections that deviate from the expected patterns can be viewed through the graph chart. You can check recurring patterns based on the past data and use them to predict future metrics values.
-
The widgets placed on the screen are not saved and reset when you go to another menu.
-
It is similar to Analysis > Metrics Chart except for the pattern and anomaly display.
-
The alert, Anomaly detection is based on the Metric anomaly detection. For more information about the Anomaly detection alert setting, see the following.
Checking the widgets
-
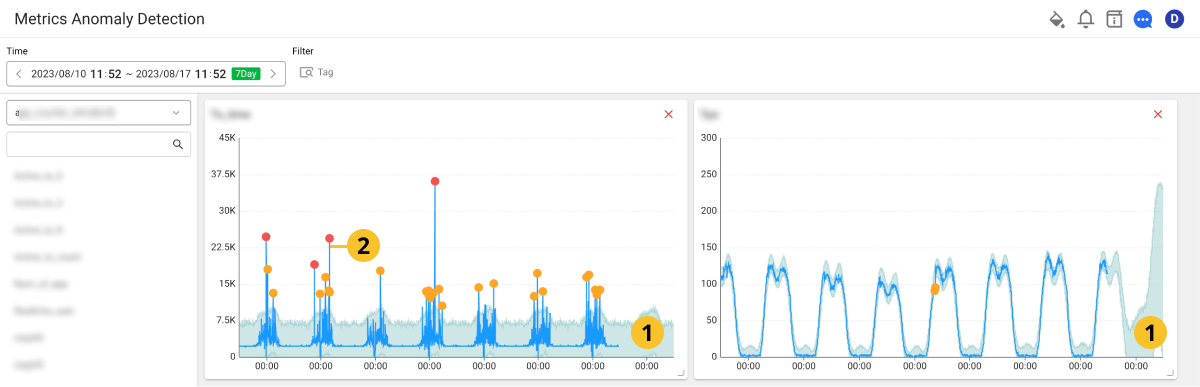
 The bright color areas of the graph are the estimated patterns analyzed by the AI.
 -
 The blue graph is the metrics trend of the project.
 -
If it deviates from the expected pattern analyzed by the AI, it displays dots on the graph in Orange and Red steps. The values that are far from the expected pattern range appear in red.
Placing the widgets
-
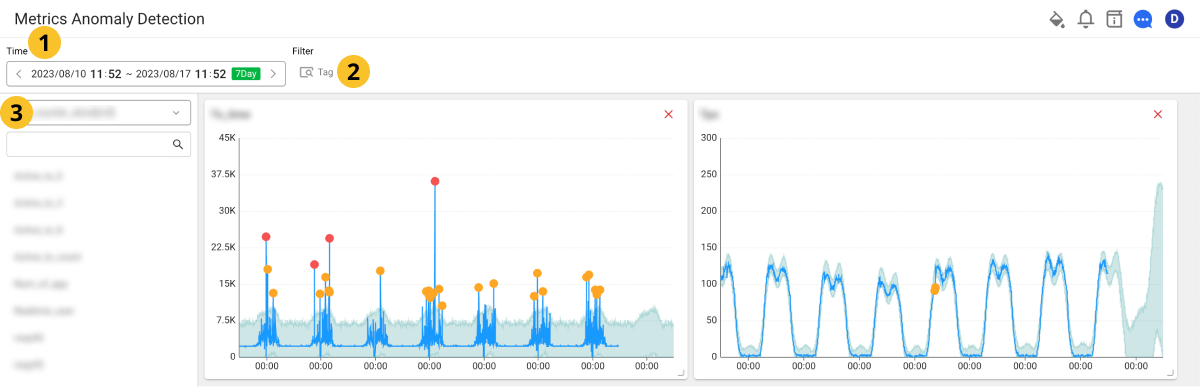
In
Time, set a desired time interval. You can set the interval up to 1 month. -
In
Filter, select a range of the metrics. -
In the following list, select a metric for monitoring.
Place the selected metric to the right of the screen.
- Select Tag to check the metrics separately by selecting a monitoring target. A tag selection list appears on the right of the screen. Select desired items, and then add widgets.
- The widgets placed on the screen are not reflected in the chart even if the Time or Tag values have been changed.
- Select
 on the upper right of the widget on the screen to delete.
 - You can reposition a widget by dragging it while selecting the upper left part of the widget.
- You can resize a widget by selecting the upper right part of the widget and then dragging it.
Deleting a widget
To delete all widgets placed on the screen, select ![]() Delete All Widgets on the screen.
Delete All Widgets on the screen.
Checking the related metrics
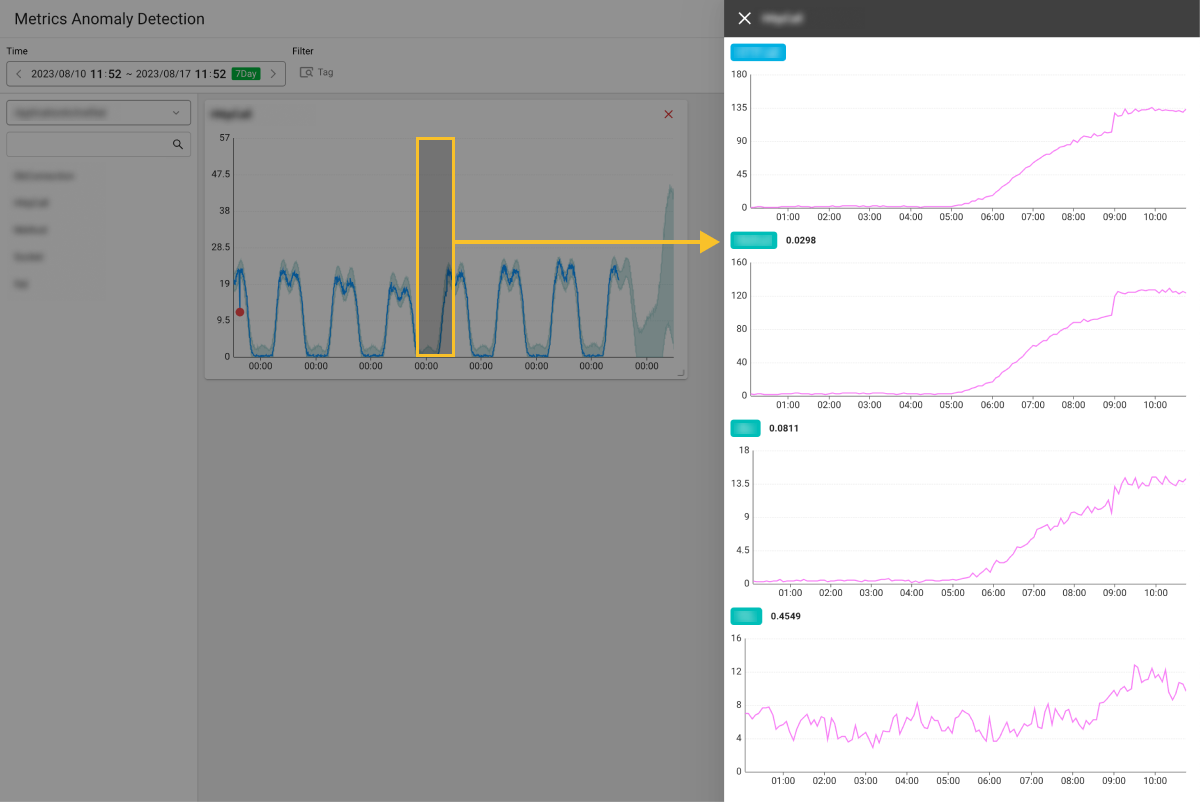
Drag part of the chart in the widget. The Similar pattern indicator window appears on the right of the screen. You can search the related metrics for up to 6 hours based on the start time of the time range you dragged.