Metrics alert
Home > Select Project > Alert > Event configuration > Select Metrics tab
What is the metrics event?
Metrics events are used to set more specific and complex events than basic events (application events, server events, and such). You can set events based on the metrics data being collected in real time from your projects. Depending on the usage, you can set any event by selecting one of two methods.
- Metrics Event
- Composite metrics event
-
For more information about the metrics, see the following.
-
You can add metrics events from the Event Configuration
Newmenu, which has a new UI for improved usability. For more information, see the following. -
This feature is only available to the members with the Alert settings role. For more information about member roles, see the following.
Metrics Event
Select Metrics on the screen in Alert > Event configuration. Select Add Alert Policy on the upper right of the screen. The Metrics event window appears.
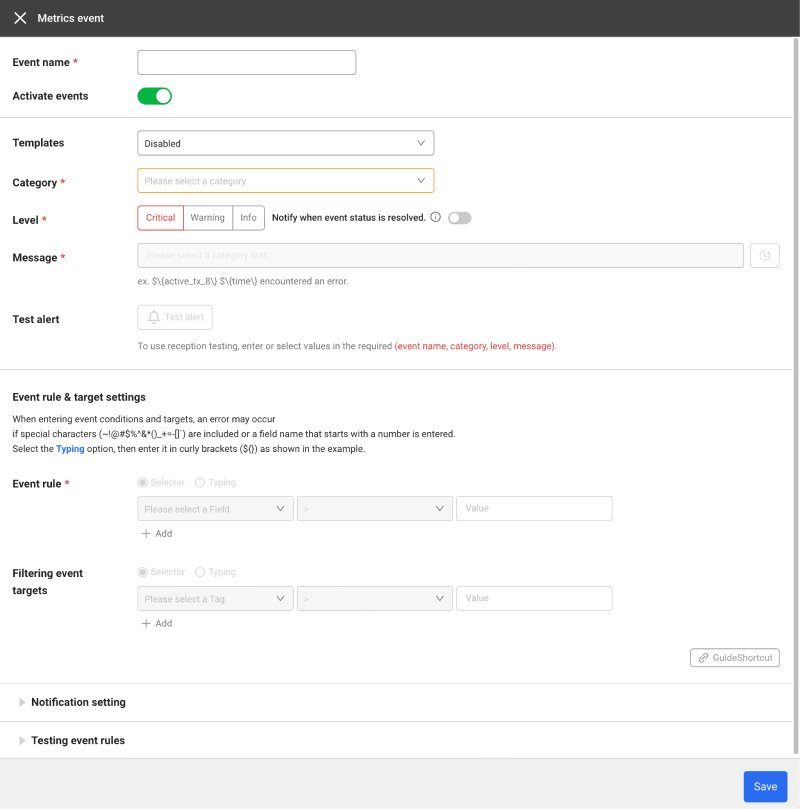
Entry of basic information
-
Event name: Enter the name of the event to add.
-
Activate events: Select whether or not to activate events.
-
Templates: Events can be easily set after selecting a template. If the template is not to be used, select Disabled.
NoteFor more information about the template list, see the following.
-
Category: The unit to identify the metrics data. It is a mandatory value for setting the metrics events.
-
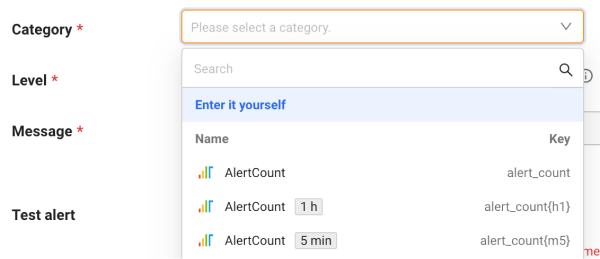
The Category selection options display
 Name and
  data collection interval, and
  Key. When setting up an event, use the key value of the category.
 -
Category retrieves metrics data being collected from projects within the last 3 hours and displays them in a list. If the collection interval is not displayed in the Category selection options, you can select Enter it yourself option to enter a category key.
-
-
Level
-
It displays the alert level when an event occurs. The levels are Critical, Warning, and Info. When setting the Critical and Warning levels, the Additional notifications when the event state is resolved. selection option is enabled.
-
Additional notifications when the event state is resolved.: You can choose whether to send Additional notifications when the event state is resolved. that occurred among events. You can turn the feature on or off by selecting the toggle button.
-
-
Message
-
Enter a notification message to be displayed when events occur. By entering
${Tag}or${Field}, you can apply the variable to the message. The key to enter in the variable must be included in Category of the selected metrics data. You can see the tags or field keys that can be entered in Metrics Search.
-
If the
 button is clicked, you can see the history of previously entered messages.
-
-
Test alert
By generating alerts based on the required items: Event name, Category, Level, and Message, this function checks the messages.
NoteTo use a reception test, enter or select required items in Event name, Category, Level, and Message.
-
Event rule
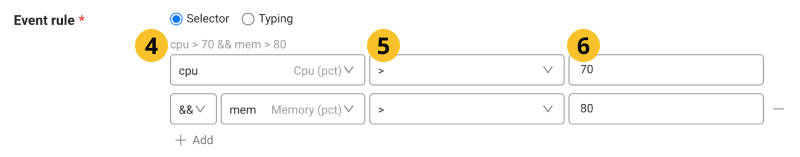
By entering the
 field,
  operator selection, and
  threshold value, set the event rule.
 -
Filtering event targets
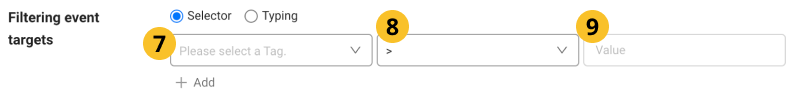
It filters the targets by entering the
 tag,
tag,  operator selection, and
  filtering value. If no input, alerts are sent to all agents.
-
For available basic syntaxes and operators in Event rule and Filtering event targets, see the following.
-
For the Event rule and Filtering event targets options, you can select Selector or Typing.
-
After the event setting is made, the option value is managed as the Typing option. Afterwards, if switched to the Selector option, the option value can be initialized.
-
Upon entry of event occurrence conditions and targets, an error may occur, if you enter a field name that contains special characters (
~!@#$%^&*()_+=-[]`) or begins with a number. In this case, select the Typing option and then enter values enclosing with curly brackets (${}) as shown in the following example:${4xxErrorType} == '401'
Notification setting
-
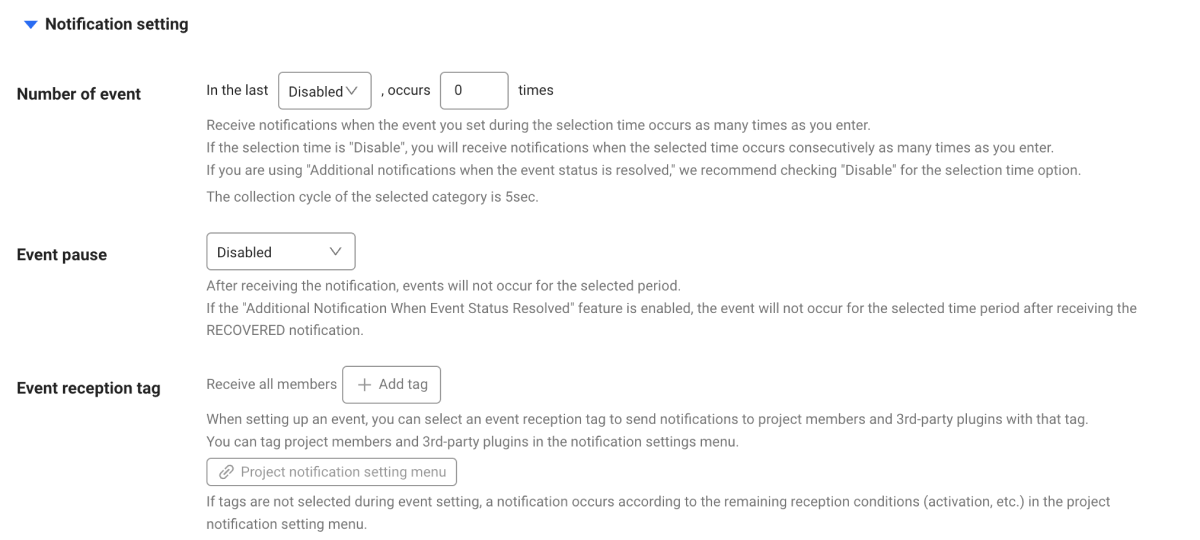
Number of event: For the selected period, if the events set in Event rule occur as many as the input, an alert is sent.
Note- If the selected time is set to Disabled, an alert is sent only when the events occur consecutively as many as the input.
- If the option, Additional notifications when the event state is resolved. is activated, it is recommended to select Disabled as the selected time.
- In the Category option, the collection cycle for the selected item is 5 seconds.
-
Event pause: This option can prevent excessive alert notifications from happening. No alerts are sent for the selected period after the first alert notification is generated. In addition, they are not recorded in Event history.
-
Related category: You can set the related categories up to 5 and see them when checking notifications.
-
Event reception tag: If this tag is selected, notifications can be sent to project members and 3rd-party plug-ins with the corresponding tags. If the event receiving tag is not selected, alerts are sent to all project members.
NoteIn Alert > Notification setting, you can set the tags in project members and 3rd-party plug-ins.
Testing event rules
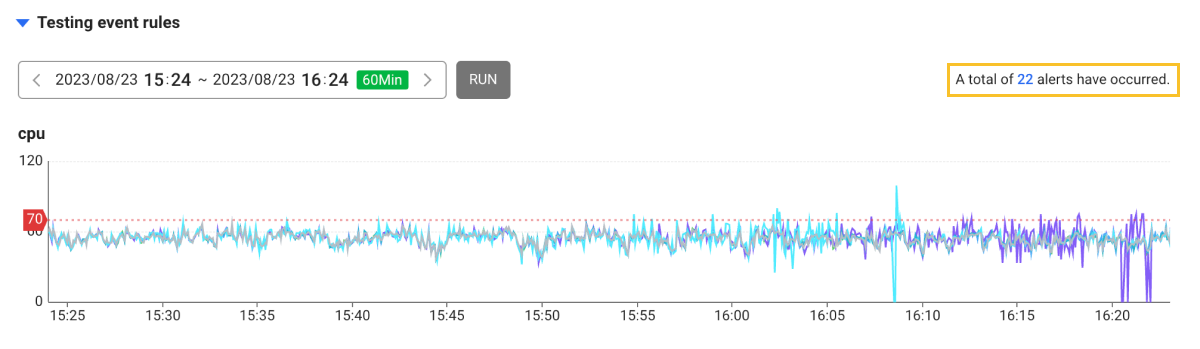
You can check how many alerts have occurred by enabling the event conditions you set for the selected time period. If your select RUN, the number of notifications occurred appears in the upper right corner. The selected field and thresholds are displayed on the chart in Event rule.
-
For more information about Event rule, see the following.
-
The Testing event rules feature can test for the data for 24 hours.
Composite metrics event
To use the Composite metrics, you have to understand the following concepts:
The Composite metrics event can generate events by using more complex rules along with the metrics data and send alerts. Composite metrics can be used effectively in the following situations:
- You have to make comprehensive decisions on data received from multiple agents.
- You have to compare the past data with the current ones to make judgment.
Metrics events make judgment whenever metrics are received from the agents. On the other hand, the composite metrics event stores the metrics collected from each agent into the database. Then they are reviewed to judge the event. Because of this characteristic, the data from multiple agents can be used collectively or the past data can be used. However, there is a barrier to entry that requires to use MXQL, the WhaTap's unique data query language. Therefore, event templates are provided so that users can effectively set events only if they understand the basic MXQL. Basic MXQL users can apply events by just modifying the query for event target filtering and conditions.
-
Select Metrics on the screen in Alert > Event configuration.
-
In the Composite metrics section, select Add Alert Policy on the right.
-
If the Composite metrics window appears, select Creating as a chart.
The Event Setting window appears.
To set a composite metrics event, you have to have the event setting role.
For more information about the event templates for composite metrics, see the following.
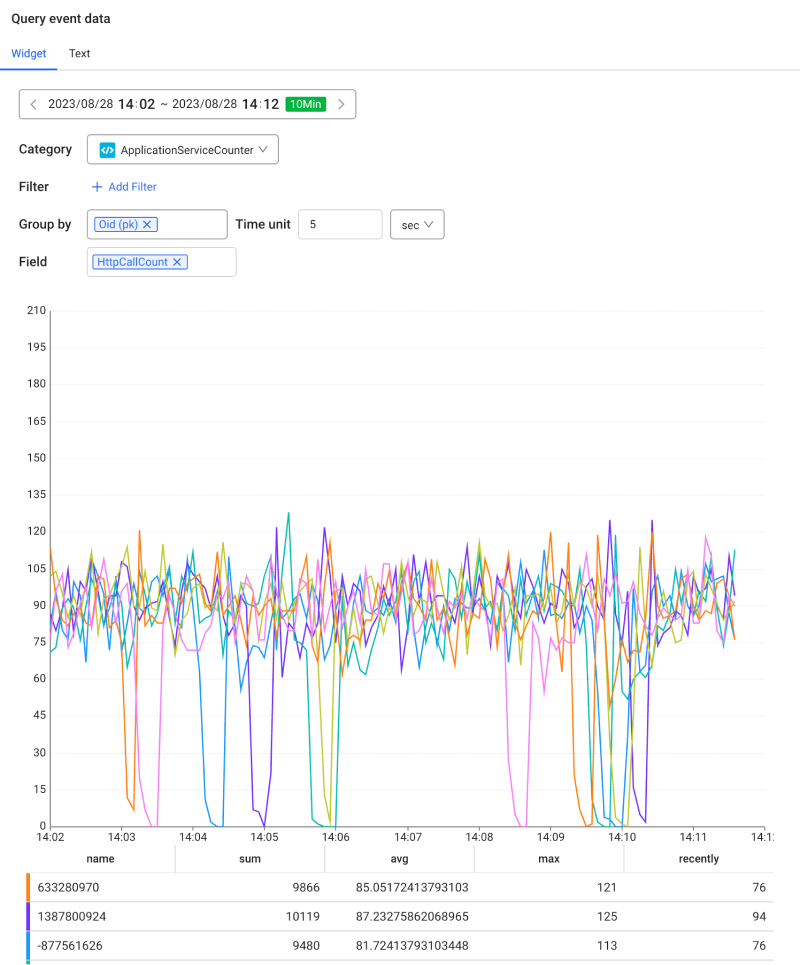
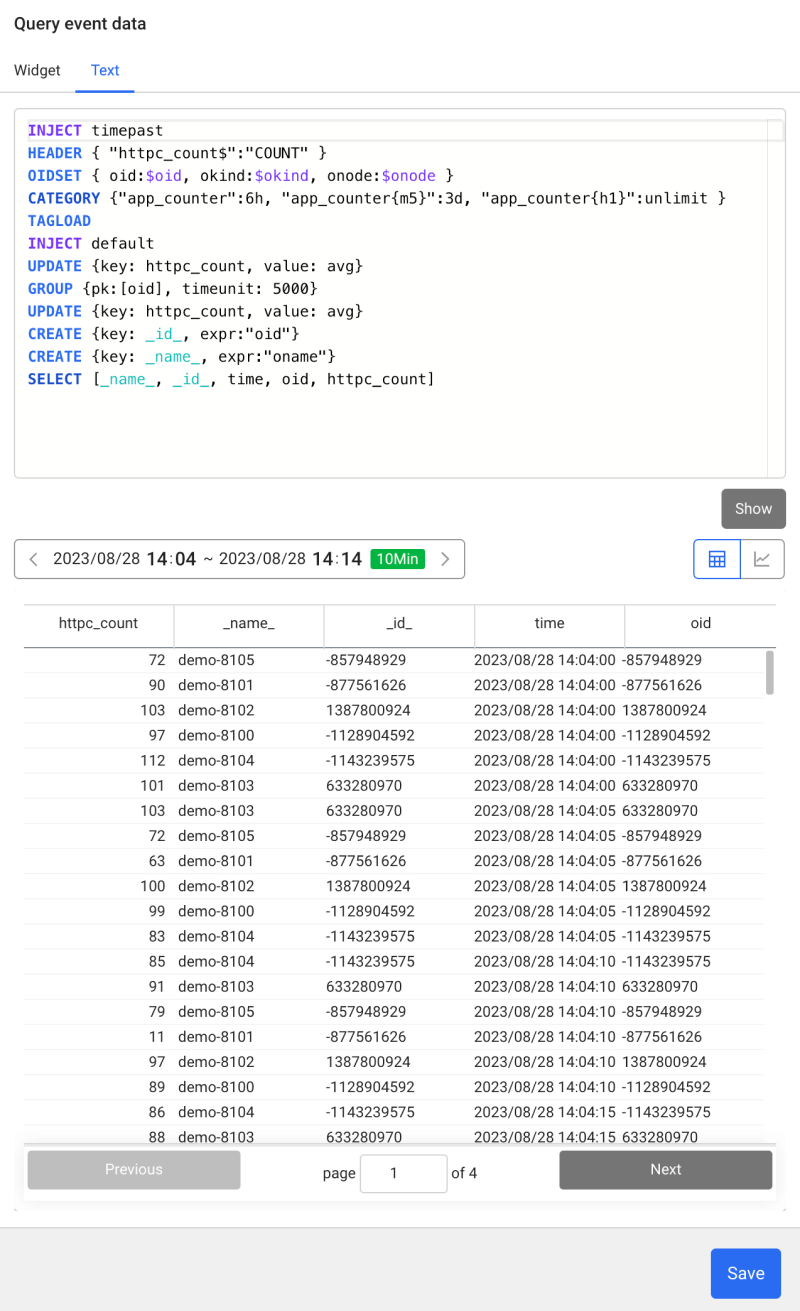
Query event data
Composite metrics The event creates event conditions by using MXQL, a metrics data query language. The Creating as a chart function provides a combo box function for automatic completion of MXQL. This template is used to query the event data, construct a chart, and then directly enter the event generation conditions. Select the Widget or Text option, and then configure the event.
- Widget
- Text
Through the option to configure the time series charts, you can autocomplete MXQL for using when setting events.
-
Filter: Select an event condition target. Enter values for
formula, tag, and filtering values to create filtering conditions.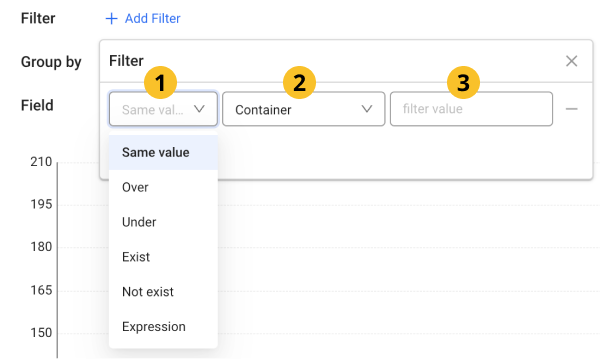
-
Group by: Select the grouped metrics data. You can select multiple items.
-
Time unit: Set the time criterion for dividing the grouped data. You can set it by selecting sec, Minutes, and Hour.
-
Field: Select fields to use as event generation conditions. You can select multiple items.
The editing window appears where you can modify MXQL in plain text.
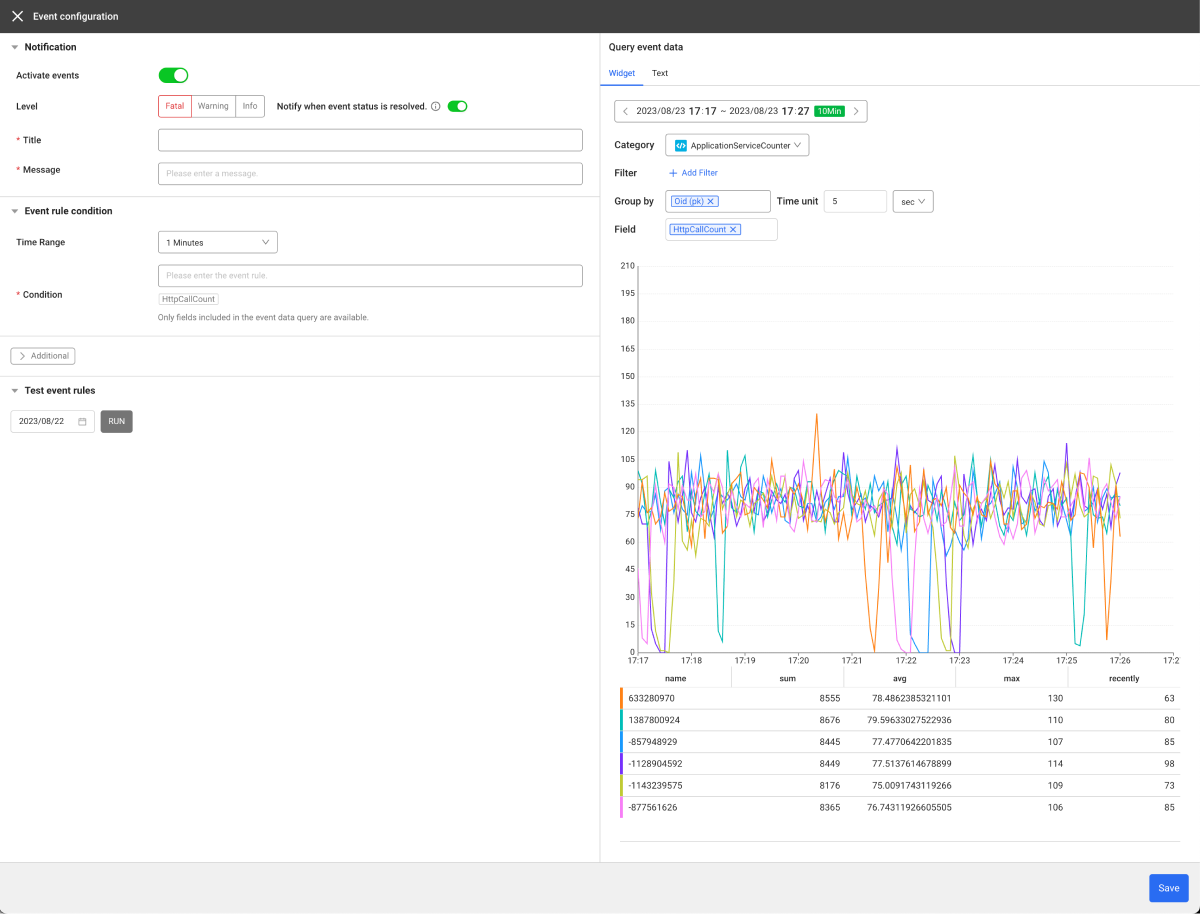
Notification
Enter basic data for alert settings.
-
Activate events: You can select to enable or disable the events by clicking the toggle button.
-
Level: Select a level among Fatal, Warning, and Info.
Additional notifications when the event state is resolved.: You can select whether to transmit Additional notifications when the event state is resolved. among events. This function can be enabled or disabled by selecting the toggle button.
-
Title: Enter the title of the alert.
-
Message: Enter a notification message to be displayed when events occur. By entering
${Tag}or${Field}key, you can apply the variable to the message. The key to enter in the variable must be included in Category of the selected metrics data. You can see the tags or field keys that can be entered in Metrics Search.
Alert Policy
Enter the conditions to send alerts.
-
Time Range: Set the time range to view the MXQL real-time data for event conditions. You can use only the fields included for viewing the event data.
Composite metrics events retrieve metrics in DB for later use. Therefore, first specify the time range to query data. If you select 5 minutes for the data lookup time, the event generation conditions are checked by searching for the data collected for the last 5 minutes. You can set it short when you set any event for recent data, or long when you want to approach statistically for a wide period.
NoteFor actual usage examples, see the following.
-
Condition: Enter the fields, calculation rules, and thresholds reflected in MXQL.
Additional information
Set additional options that are related to receiving alerts.
-
Interval: Check the notification conditions at the selected time interval.
-
Silent: This option can prevent excessive alerts from happening. No alerts are sent for the selected period after the first alert notification is generated. In addition, they are not recorded in Event history.
-
Event reception tag: If you select an event receiving tag, alert notifications can be sent to project members and 3rd-party plug-ins with the tag. If the event receiving tag is not selected, alerts are sent to all project members.
NoteIn Alert > Notification setting, you can set the tags in project members and 3rd-party plug-ins.
Test Event Rules
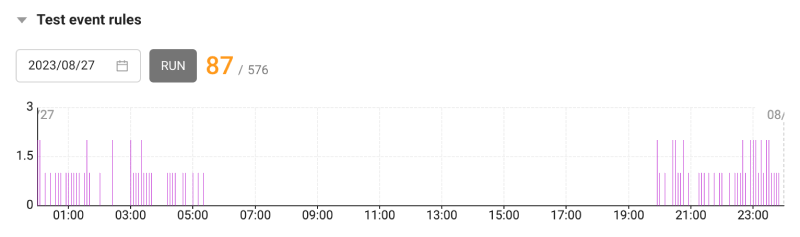
You can check how many alerts have occurred by enabling the event conditions you set for the selected time period. If you select Run, you can see the number of notifications, and the selected fields and thresholds are displayed on the chart when the event conditions are met.
Most of what is included in Event Setting can be specified using MXQL. It provides the function to simulate whether MXQL has been properly written. The simulation function queries the past 24-hour data to make judgment, and then informs you how many metrics were queried and how many of them are successful.
Modifying and deleting metrics events
-
Go to Alert > Event configuration and then select the Metrics tab.
-
In the event list, select
 at the utmost right of the item to modify or delete.
 -
If the metrics or composite metrics event setting window appears, modify each option and then select Save.
To delete the selected event, select
 Delete on the upper right of the event setting window.
Guide to select generation conditions and targets
For the event generation conditions and selection of event targets on metrics alerts, use the same syntaxes. For event generation conditions, use the tag key as a variable. For selection of event targets, use the field key as a variable.
Basic syntax rules
-
If you just enter a string, it is recognized as a variable. If you enclose it in single quotation marks ('') or double quotation marks (""), it is recognized as text.
oid == "oid"1. oid: variable
2. ==: function
3. "oid": text// In case oname is ott-1235
// Normal cases
onname = 'ott-1235' or onname = "ott-1235"
// In abnormal cases, notification does not work.
onname = ott-1235 -
If you just enter a number, it is recognized as number, and if you enclose it in single quotation marks ('') or double quotation marks (""), it is recognized as text.
oid == 1231. oid: variable
2. ==: function
3. 123: number// In case oid is 123
// Normal cases
oid = 123
// In abnormal cases, notification does not work.
id == '123' or oid == "123"
List of available operators
| Operator | Usage | Description |
|---|---|---|
== | operand1 == operand2 | It checks whether operand1 is equal to operand2. |
!= | operand1 != operand2 | It checks whether operand1 and operand2 have different values. |
> | operand1 > operand2 | Check whether the operand1 value is greater than the operand2 value. |
>= | operand1 >= operand2 | Checks whether the operand1 value is greater than or equal to the operand2 value. |
< | operand1 < operand2 | Check whether the operand1 value is less than the operand2 value. |
<= | operand1 <= operand2 | Check whether the operand1 value is less than or equal to the operand2 value. |
like | operand1 like operand2 | Search with patterns whether operand1 includes operand2. |
&& | expression1 && expression2 | Check whether expression1 and expression2 are all true. |
and | expression1 and expression2 | Check whether expression1 and expression2 are all true.The operator plays the same role as &&. |
|| | expression1 || expression2 | Check whether expression1 and expression2 are all true. |
or | expression1 or expression2 | Check whether expression1 and expression2 are all true.The operator plays the same role as ||. |
Usage of like
You can conveniently search for embedded strings via the wildcard (*).
-
Searching for strings that start with a specific keyword
Key like "Value*" -
Searching for strings that end with a specific keyword
Key like "*Value" -
Searching for strings that include a specific keyword
Key like "*Value*" -
The wildcard (
*) cannot be used in the middle of keywords.
// Unsupported syntax
Key like "Va*lue" -
If you omit the wildcard (
*) in thelikeoperator, it operates as equals (==).
// The following two statements have the same result.
Key like "Value"
Key == "Value"
Available functions
| Method | Usage | Description |
|---|---|---|
| startsWith | startsWith(param1, param2) | If the value whose param1 is the key starts with param2, the result is true. Otherwise, the result is false. |
| endsWith | endsWith(param1, param2) | If the value whose param1 is the key ends with param2, the result is true. Otherwise, the result is false. |
| isNull | isNull(param1) | If param1 is null, the value becomes true. Otherwise, the value becomes false. |
| isNotNull | isNotNull(param1) | If param1 is not null, the value becomes true. Otherwise, the value becomes false. |
| isEmpty | isEmpty(param1) | If param1 is null or EmptyString(""), the value becomes true. Otherwise, the value becomes false. |
| isNotEmpty | isNotEmpty(param1) | If param1 is not null nor EmptyString(""), the value becomes true. Otherwise, the value becomes false. |
startsWith
startsWith(Key, "Value")
endsWith
endsWith(Key, "Value")
isNull
isNull(Key)
isNotNull
isNotNull(Key)
isEmpty
isEmpty(Key)
isNotEmpty
isNotEmpty(Key)
Template
Metrics Event
In the Alert > Event Configuration > Metrics section, select Add Alert Policy. Select a desired item in Templates.
-
WARNING_OLD_GENARATION_GC
An alert is sent when GC occurs in the Old Generation area of the heap memory.
-
TOO_SLOW_SQL
An alert is sent when a query has been issued too slow (more than 5 seconds).
-
TOO_MANY_ACTX
An alert is sent when the number of active transactions in the area exceeding 8 seconds exceeds 100.
-
APDEX
An alert is sent when the APDEX figure is less than 0.7.
Composite metrics event
-
Inactive agents has been found.
Condition:
num_of_current_agents< 6An alert is sent when an event occurs each time the number of normal agents among all agents in the project drops below 6.
-
Very slow active transactions are detected.
Condition:
very_slow_tx_cnt_m5_avg> 10An alert is sent when the sum of transactions that take more than 8 seconds in an agent belonging to a specific
okindof the project exceeds 10. -
TPS has changed by more than 30% compared to the previous week.
Condition:
one_week_diff_abs>current_tps* 0.3An alert is sent when the sum of TPS of the agents that belong to a specific
okindof the project changes by more than 30% compared to 7 days ago.
When you have to make a comprehensive decision on the data received from multiple agents, configure the following composite metrics templates.
- Inactive agents has been found.
- Very slow active transactions are detected.
When you have to determine an event by comparing the past data with the current data, configure the following composite metrics templates.
- TPS has changed by more than 30% compared to the previous week.