Transaction Map
Home > Select Project > Dashboard > Transaction map
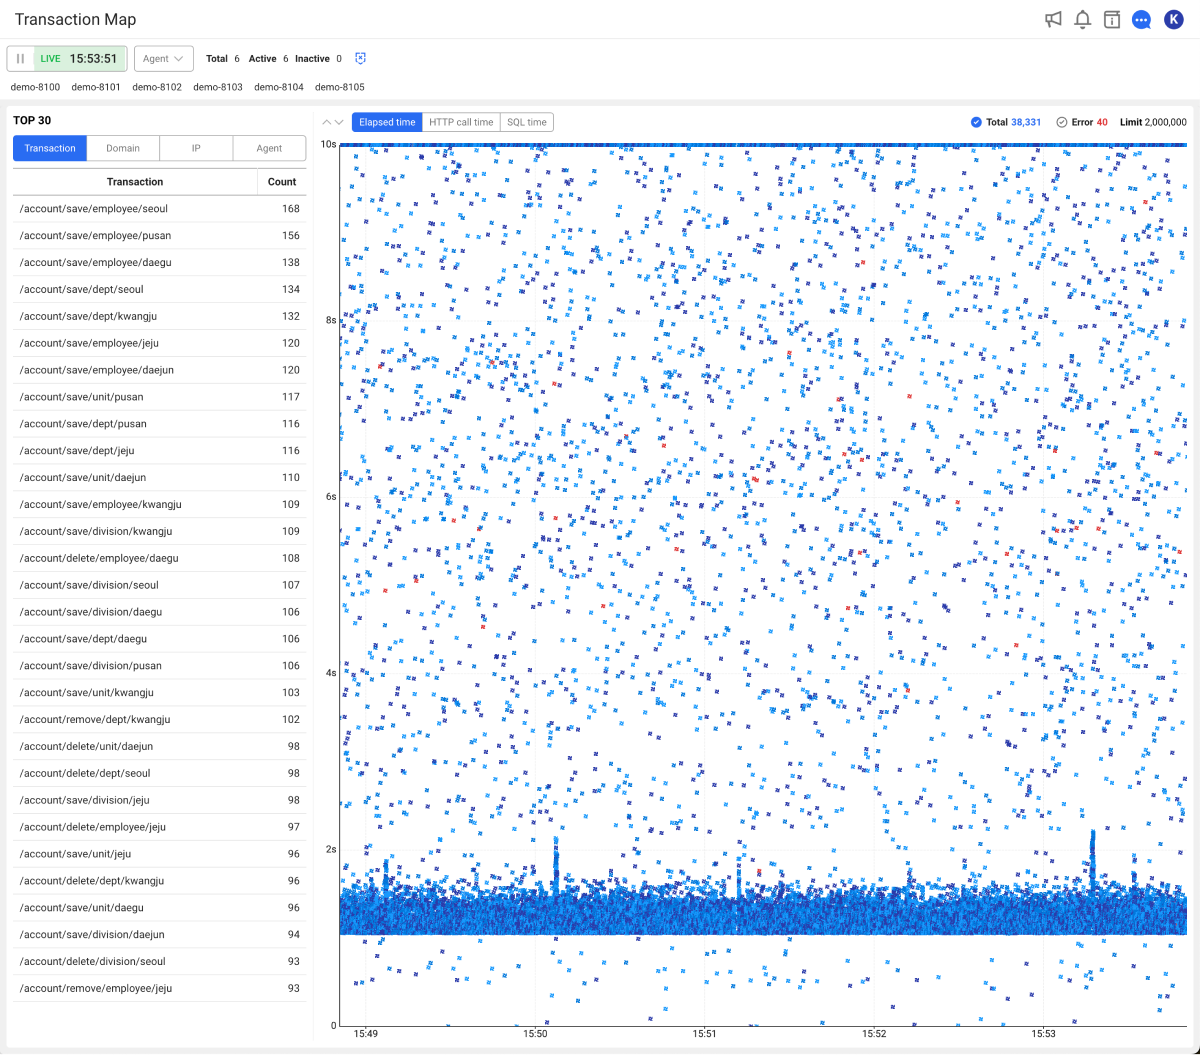
The Transaction map chart displays the response times for each completed transaction in the distribution chart form. Same as the hitmap, you can find and analyze problems based on the distribution patterns. Hitmap displays the grouped transactions every 5 seconds, but Transaction map displays transactions individually.
The items changed through Service 2.2.0 release are as follows:
-
You can view the data up to 5 minutes in real time and up to 10 minutes for the past. (Before: limited up to 5 minutes in real time)
-
When searching for the previous data, the data received from the server can be filtered.
-
The number of data that can be searched through the Trace analysis window has been changed from 100 to 1000.
-
The counts for transactions and errors are displayed in real time.
-
The keyboard events have been added to the TOP 30 list and chart area. By selecting the keyboard direction button, you can move to the desired position.
For more information about the Transaction map menu reorganization, see the following link.
How is it different from the hitmap analysis?
A hitmap chart displays the sum of transactions in a specific section. Differences are expressed in color where the number of occurrences is high. In case of the hitmap, the sums for each section are stored separately. Accordingly, you can check the trend over a relatively long time. However, because transactions are aggregated and displayed, it is difficult to know individual transactions.
-
To analyze the distribution of the long-term, high-volume transactions, use the hitmap analysis (Analysis > Hitmap).
-
To do performance test, or analyze the transaction distribution within 1 to 5 minutes upon a failure, or check the transaction distribution without limiting the execution time, check the Transaction map.
-
For more information about Hitmap, see the following.
-
For more information about the analysis method of the HITMAP transaction chart, see the following.
-
If the user's PC time has been set to be older than the server time, the data may not appear on the chart if the server time and the user's PC time differ by more than 5 minutes.
Analyzing a trace
If you drag the chart area of Transaction map, the Trace analysis window appears where you can check the transaction details. You can see the transaction list and the steps under each transaction at once.
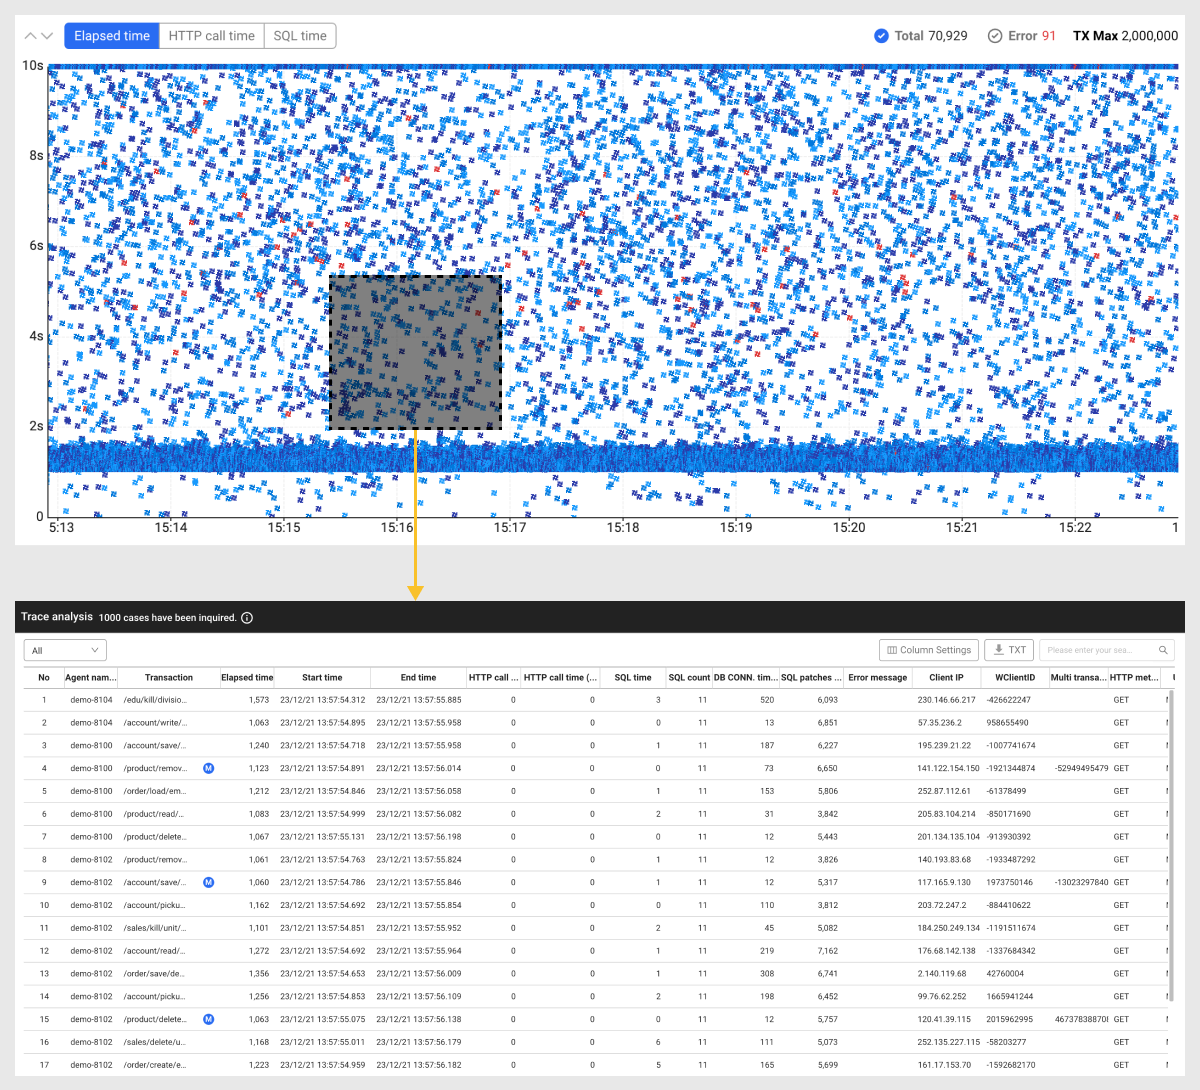
After dragging the chart area, you can see up to 1,000 items in the Trace analysis window.
For more information about Trace analysis, see the following.
Changing the lookup criteria
Select the chart area of Transaction map and then the button at the upper left to change the data lookup criteria.
-
Elapsed time: The data is searched based on the elapsed time of the executed transaction.
-
HTTP call time: The data is searched based on the response time for HTTP calls.
-
SQL time: The data is searched based on the SQL patch time.
If you select Error on the upper right of the chart area, you can view only the transactions with errors. If you drag a transaction on the chart in this state, the Trace analysis window that displays a list of erroneous transactions. To view all transactions, select Total.
You can easily change the maximum value of the Y-axis by selecting ![]() or
or ![]() on the upper left of the chart. You can also access the same function by pressing the up or down button on the keyboard.
on the upper left of the chart. You can also access the same function by pressing the up or down button on the keyboard.
The maximum number of transactions (Limit) displayed on the chart in Transaction map is 2,000,000.
Viewing the past data
Transaction map provides the real-time monitoring by default. By default, the data can be viewed in real time for 5 minutes. Click the green button in the time selector to select a desired lookup time.
To view the historical data, select ![]() in the time selector. It changes to period viewing mode and you can view the transaction data for up to 10 minutes. The chart data of Transaction map based on the date and time set by the user is refreshed.
in the time selector. It changes to period viewing mode and you can view the transaction data for up to 10 minutes. The chart data of Transaction map based on the date and time set by the user is refreshed.
-
The range of the historical inquiries may differ depending on the transaction volume.
-
To switch to the Realtime mode after a historical inquiry, select
 .
. -
For more information on how to use the time selector, see the following.
Applying filters
While viewing the past data, you can quickly filter out the data by applying filters.
-
If
 is selected in the time selector, the filter input box appears.
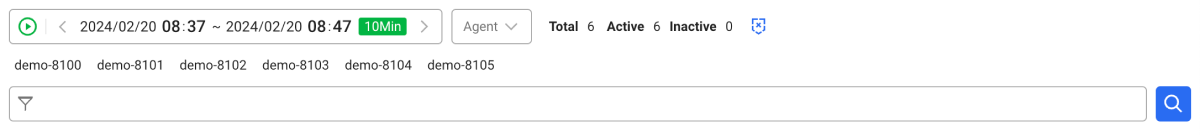
-
If the filter field is selected, the filters that can be selected appear. You can select the following options.
- Elapsed time
- Transaction
- Domain
- IP
-
If the list of filterable values appears, select desired items.
NoteIf Elapsed time is selected as a filter, enter the time. The unit is milliseconds (ms).
-
Select
 .
.
It updates the filtered data in the Top 30 list and the Transaction map chart.
-
You can perform filtering by setting multiple conditions. Added conditions are applied based on
&&. For example, if the transaction is/account/save/employee/seouland the elapsed time is more than 3 seconds, you can apply as follows:Transaction=/account/save/employee/seoulElapsed time (ms)>=3 -
Elapsed time cannot be applied additionally.
Checking the agent
Checking the agent connection status
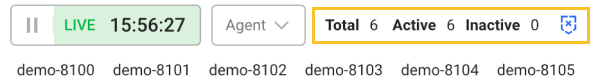
On the upper left of the screen, the right area of the time selector provides information that allows you to check the status of agents connected to the project. This allows you to immediately check whether the target application server is running.
-
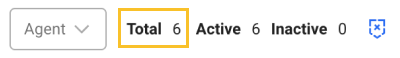
Total: Number of all agents connected to the project
-
Active: Number of active agents
-
Inactive: Number of inactive agents
-
 : Can display or hide inactive agents.
Agent-based monitoring
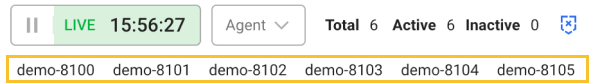
By default, the chart displays the metrics collected from all agents in charts and you can also view the data by agent. Select one or more agents under the time selector. The chart is updated with the transactions of the selected agent.
To select all agents again while one or more agents is selected, deselect them or select Total.
If there are numerous agents connected to the project, it is efficient to set the agent names to be short. For more information about the agent name setting, see the following.
Monitoring each classified agents
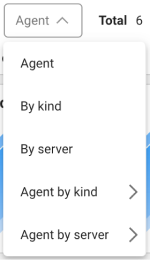
You can select and monitor agents by each group classified through agent settings.
-
Agent: You can select an individual agent or all agents.
-
By kind: Agents can be monitored in each group classified by
whatap.okindin the agent configuration. -
By server: Agents can be monitored in each group classified by
whatap.onodein the agent configuration. -
Agent by kind: Only the agents classified as
whatap.okindin the agent configuration can be monitored. -
Agent by server: Only the agents classified as
whatap.onodein the agent configuration can be monitored.
For more information about the agent configuration, see the following.
Searching the agent
If the agents connected to the project are numerous and difficult to find, use the agent search function. If you select ![]() Search on the upper right of the screen, a box appears where you can enter a string.
Search on the upper right of the screen, a box appears where you can enter a string.
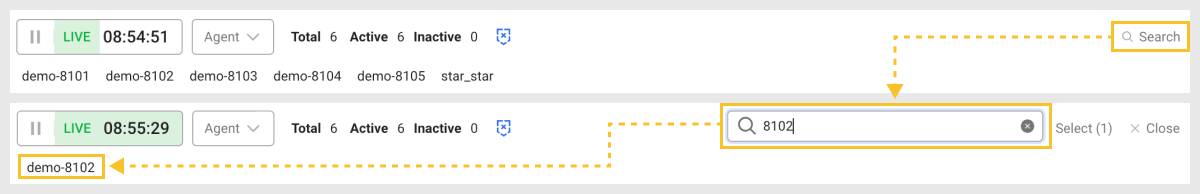
The agents that match the entered string appear in the list. To filter the data in the dashboard based on the searched agents, select Select on the right of the text entry box.
To reset the selected agents, click Total on the right of the agent selection option.
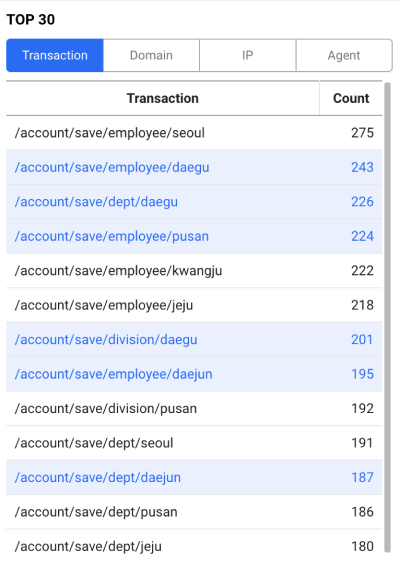
Checking the upper list
In the Top 30 section, the list of top 30 items with the highest transactions performed based on Transaction, Domain, IP, and Agent.
-
Transaction: You can see the list of the top 30 items, aggregated by the transaction URL.
-
Domain: You can see the list of the top 30 items aggregated based on the Internet address specified in the address of the IP connected by the client.
-
IP: You can see the list of the top 30 items, aggregated by the client IP address.
-
Agent: You can see the list of the top 30 items aggregated by the agent included in the project.
If you select each item from the list, the data is applied based on the item selected in the Transaction map chart. To select multiple items, hold down the Ctrl (Windows/Linux) or CMD (Mac) key and then click desired items.
You can move an item in the list of the Top 30 section by pressing the up or down arrow button on the keyboard.
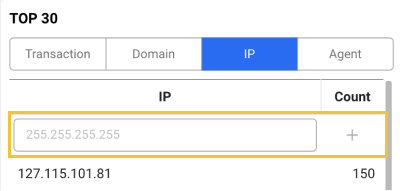
Add custom IP address
When viewing the number of transactions executed based on IP in the TOP 30 section, the function is provided to check constantly by adding a specific IP address.
-
In the TOP 30 section, select IP.
-
Enter a specific IP address in the field at the top of the list.
-
Select
 .
.
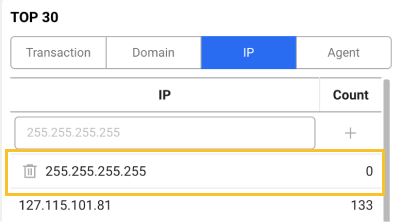
The specified IP address appears at the fixed top of the list.
To delete any added IP address, select ![]() .
.
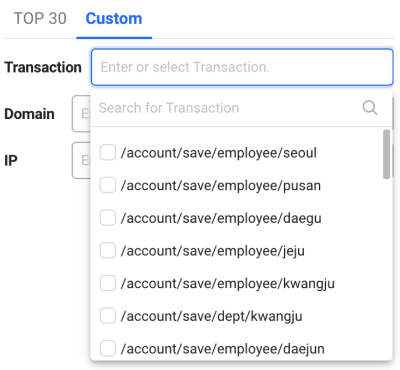
Custom monitoring
It provides the feature to check only the selected items in the response time distribution chart by adding specific transactions, domains, and IPs to the Custom tab. This allows users to efficiently monitor and analyze specific problematic items.
-
Select Custom tab.
-
You can directly enter values for Transaction, Domain, or IP, or select any in the Top 30 list.
 Note
NoteYou can search and select a desired item.
-
Select items to add.
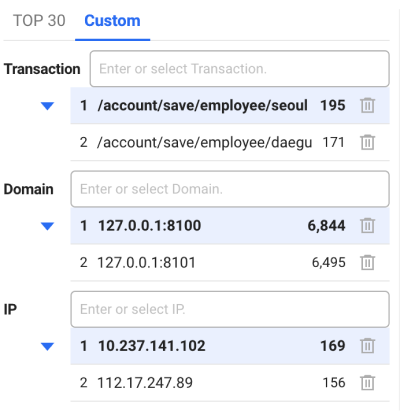
You can see the response time distribution for the selected items filtered in real time on the chart on the right.
To delete any added custom items, select ![]() .
.