Application Dashboard
Home > Select Project > Dashboard > Application dashboard
Application dashboard allows you to collect key metrics of applications through agents, configure charts to monitor the metrics in real time, and view the past data. You can quickly identify and analyze application problems by using the widgets on the dashboard.
In case of general charts excluding CPU and memory, the stable data appears in blue and the elements identified as problems appear in red, making it easy to recognize the current status.
Viewing the past data
The dashboard basically provides real-time monitoring features in which you can view the past data.
| Real-time mode | Non-real-time mode |
|---|---|
 |  |
-
Select
 in the time selector at the upper left of the screen.
 -
Click the date and time to set the desired time zone.
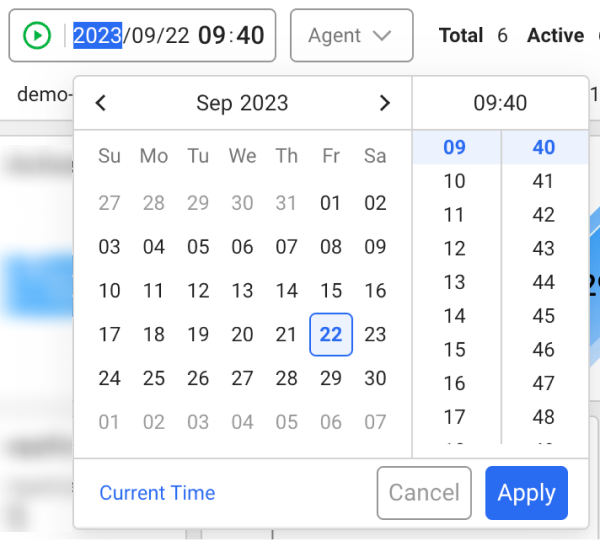
-
Select Apply.
It updates the data in widgets placed on the dashboard based on the set time. To switch to the Realtime mode, select ![]() .
.
Checking the agent
Checking the agent connection status
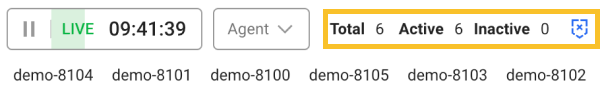
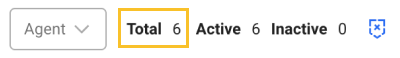
On the upper left of the screen, the right area of the time selector provides information that allows you to check the status of agents connected to the project. This allows you to immediately check whether the target application server is running.
-
Total: Number of all agents connected to the project
-
Active: Number of active agents
-
Inactive: Number of inactive agents
-
 : Can display or hide inactive agents.
Agent-based monitoring
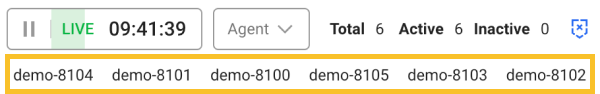
By default, the dashboard displays the metrics collected from all agents in charts and you can also view the data by agent. Select one or more agents under the time selector. The data of the widgets on the dashboard is updated with the metrics of the selected agent(s).
To select all agents again while one or more agents is selected, deselect them or select Total.
If there are numerous agents connected to the project, it is efficient to set the agent names to be short. For more information about the agent name setting, see the following.
Monitoring each classified agents
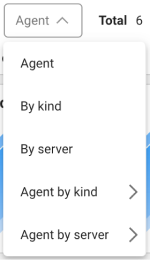
You can select and monitor agents by each group classified through agent settings.
-
Agent: You can select an individual agent or all agents.
-
By kind: Agents can be monitored in each group classified by
whatap.okindin the agent configuration. -
By server: Agents can be monitored in each group classified by
whatap.onodein the agent configuration. -
Agent by kind: Only the agents classified as
whatap.okindin the agent configuration can be monitored. -
Agent by server: Only the agents classified as
whatap.onodein the agent configuration can be monitored.
For more information about the agent configuration, see the following.
Searching the agent
If the agents connected to the project are numerous and difficult to find, use the agent search function. If you select ![]() Search on the upper right of the screen, a box appears where you can enter a string.
Search on the upper right of the screen, a box appears where you can enter a string.
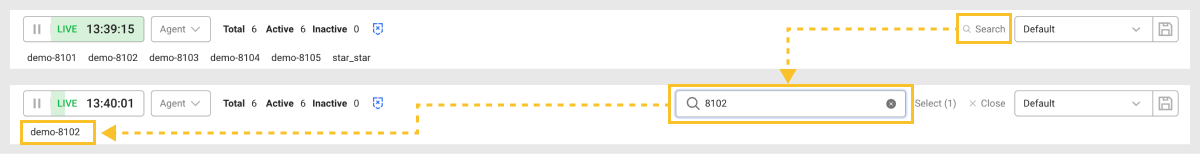
The agents that match the entered string appear in the list. To filter the data in the dashboard based on the searched agents, select Select on the right of the text entry box.
To reset the selected agents, click Total on the right of the agent selection option.
Editing a dashboard widget
The widgets on the dashboard can be adjusted to the desired size and placed in the desired positions. You can also delete unnecessary widgets or add them again.
Resizing a widget
Click and hold the mouse on the  element at the lower right of the widget, and then drag it to the desired size. Grids with a uniform horizontal-to-vertical ratio appear and the size of the widget can be adjusted in each grid.
Moving a widget
When you move the mouse cursor to the top of the widget, the cursor shape changes to  . At this time, you can move the widget by dragging with your left mouse button and move to the desired position.
Deleting a widget
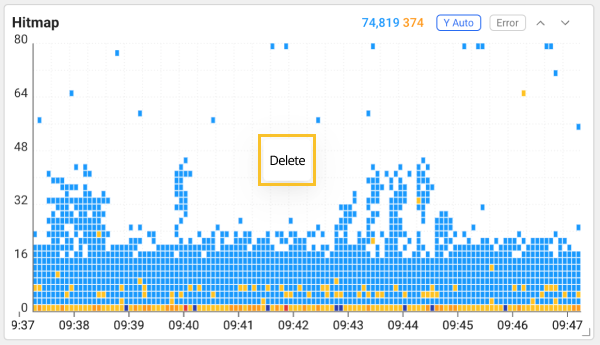
Right-click on a widget to delete. If you select Delete, the widget is deleted from the dashboard.
Adding a widget
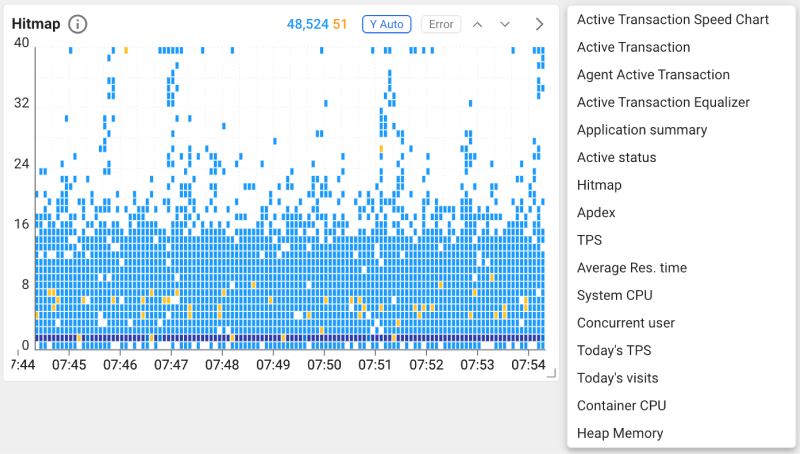
Move the mouse cursor to an empty space on the dashboard and then right-click on it. Select a widget to add from the pop-up menu. Place the widget to the desired position and then resize it.
-
For more information about the widgets that can be placed on the dashboard, see the following.
-
The widgets that can be added are fixed, but we plan to increase supports through future updates.
-
In addition to the metrics provided by default on the dashboard, you can add the desired metrics. For more information about custom widgets, see the following.
Setting presets
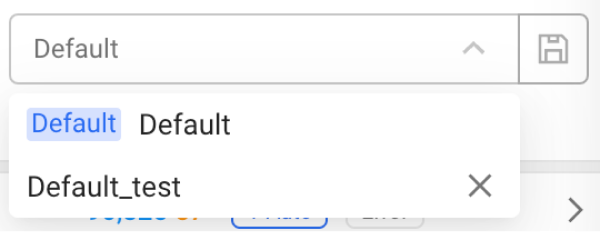
You can save and load the settings and layouts for widgets on the dashboard. You can create a new preset by adjusting its size and placing it on the desired position.
-
Using Default, the specified preset cannot be changed.
-
You can save or modify the presets with the Edit project role. For more information about the member roles, see the following.
Creating a new preset
-
Place the widgets in the desired format on the dashboard. You can also resize and place only the widgets to be frequently checked.
-
On the upper right of the screen, select
 .
. -
Enter a new preset name.
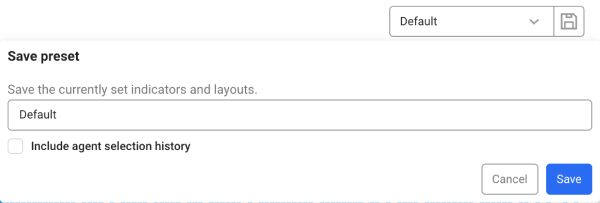
To save the selected agent data, select Include agent selection history.
-
Select Save.
You can see the newly saved preset from the preset list.
-
If any changes are made to the newly created preset, save the preset again. Select
and then save the preset with the same name. Any changes are overwritten in the existing preset. -
If you go to another menu without saving changes on the dashboard, the changes are not saved.
-
Presets are saved on a project basis and can be shared with other users.
Deleting presets
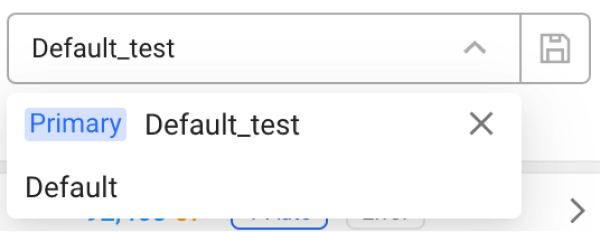
If you have unused presets, you can delete them from the preset list. Select ![]() on the right of the item to delete from the preset list.
on the right of the item to delete from the preset list.
The Default preset cannot be deleted.
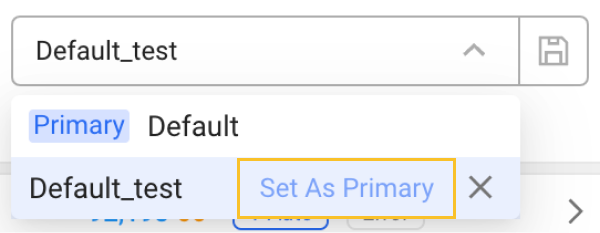
Changing the default preset
You can change the preset displayed when you first enter the Application Dashboard menu.
-
Check the preset selection box on the upper right of the dashboard.
-
Hover your mouse over a desired preset to set it as default.
-
If the Set as primary button appears, select it.
The selected preset is changed to the default preset, and the Primary tag appears in the preset list.
Using the widget options
The icons displayed on the widget function as follows:
-
 : You can see the features and information for major widgets.
 -
 Merge/view each: The agent data for the widget is displayed individually or merged in a graph.
 -
 Detail: A modal window appears where you can search the data of the widgets separately by agent.
The provided options may differ depending on the widget.
Learning about the widgets
This document mainly describes the widgets placed on the Application dashboard. For more information about how to analyze transactions and users, services, and resources through Application dashboard, see the following documents:
Agent-related widgets
You can see the application information through the agent installed on the application.
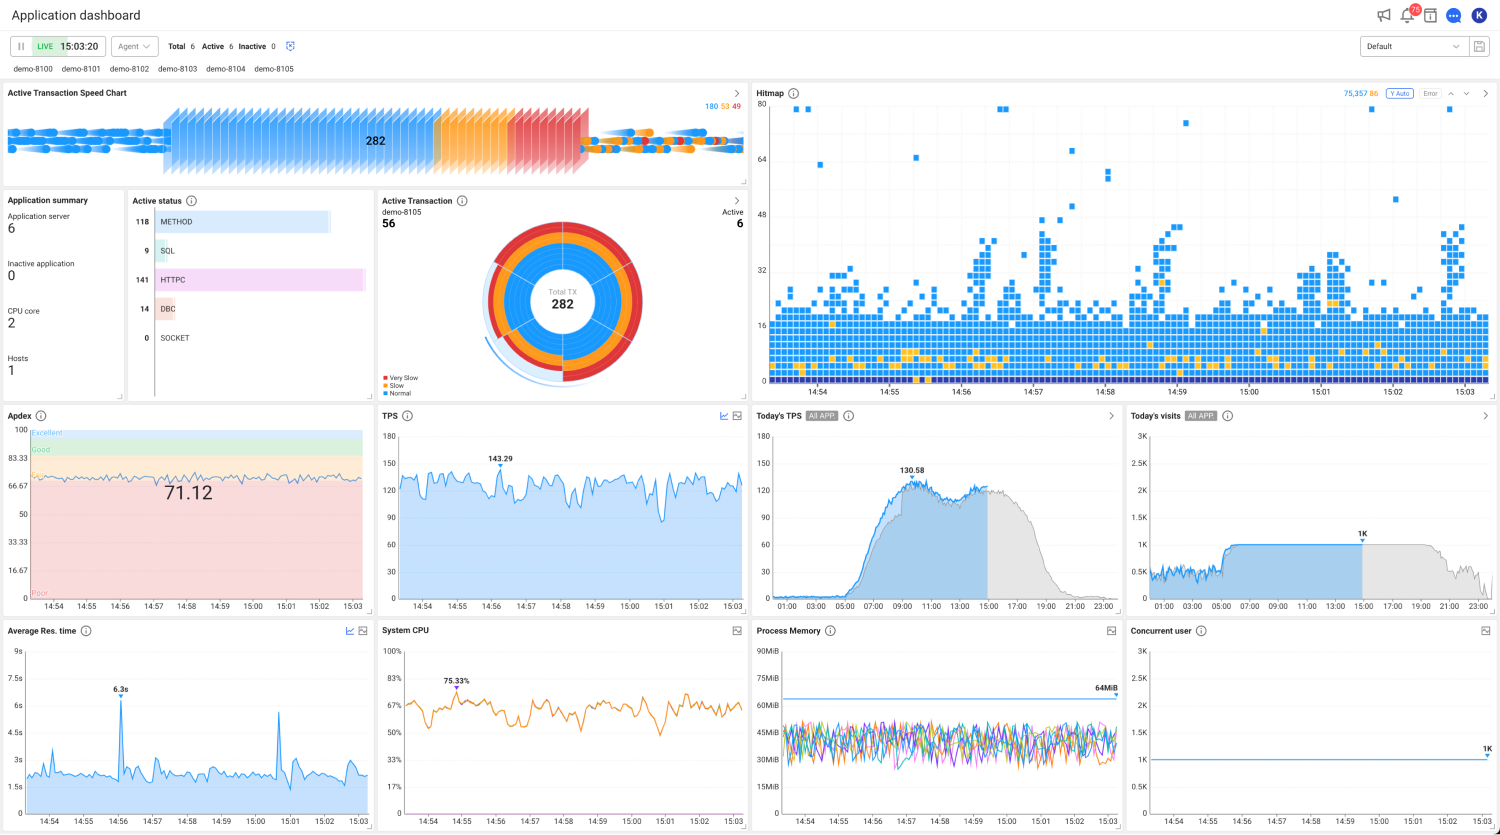
Application summary
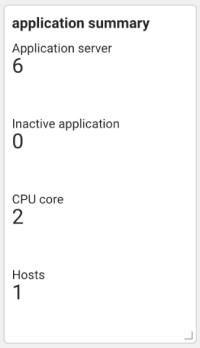
It displays the execution status and number of applications registered in the project, CPU core count, and host count.
Transaction-related widget
The failure status that can be checked through the transaction, can be recognized through the priority response time. If a transaction in progress does not end, this should be considered a failure. WhaTap divides sections for display by the time of the progress status. Blue (Normal) means transactions within the specified response time, Orange (Slow) means slow transactions with the response time of around 8 seconds, and Red (Very slow) means transactions with the response time that is twice as slow as normal. This allows you to intuitively recognize failures as fast as possible.
Active Transaction Speed Chart
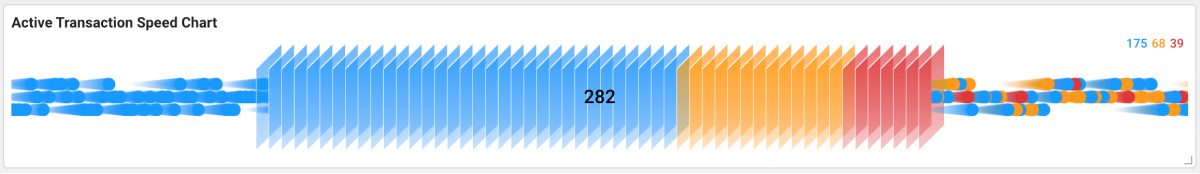
You can see the status of active transactions (middle area) and completed transactions (right area). The water drop icon passing from left to right means a transaction. If you click a chart area, a pop-up window appears where you can see a list of active transactions. If you select one of the transaction lists, you can view the transaction details, SQL query, and call stack information.
-
Area on the left
This indicates the number of requested transactions and displays data in proportion to the number of transactions.
-
Area in the middle
The status of active transactions is color displayed by the speed along with the count at the upper right. The number in the chart is the total number of active transactions. The colors in the chart indicate as follows:
-
Blue (Normal): 0 to 3 seconds
-
Orange (Slow): 3 to 8 seconds
-
Red (Very Slow): 8 seconds or more
-
-
Area on the right
This indicates the Application Performance Index (Apdex). This metric is measured for customer satisfaction of a web application and has a value between 0 and 1. The droplet flying speed is proportional to the total number of Apdex transactions, and the droplet colors mean as follows:
-
Blue: Apdex satisfied count
-
Orange: Apdex tolerating count
-
Red: Apdex frustrated count =
Total number of APDEX transactions- (Apdex satisfied count+Apdex tolerating count)
NoteFor more information about the Application Performance Index (Apdex), see the following link.
-
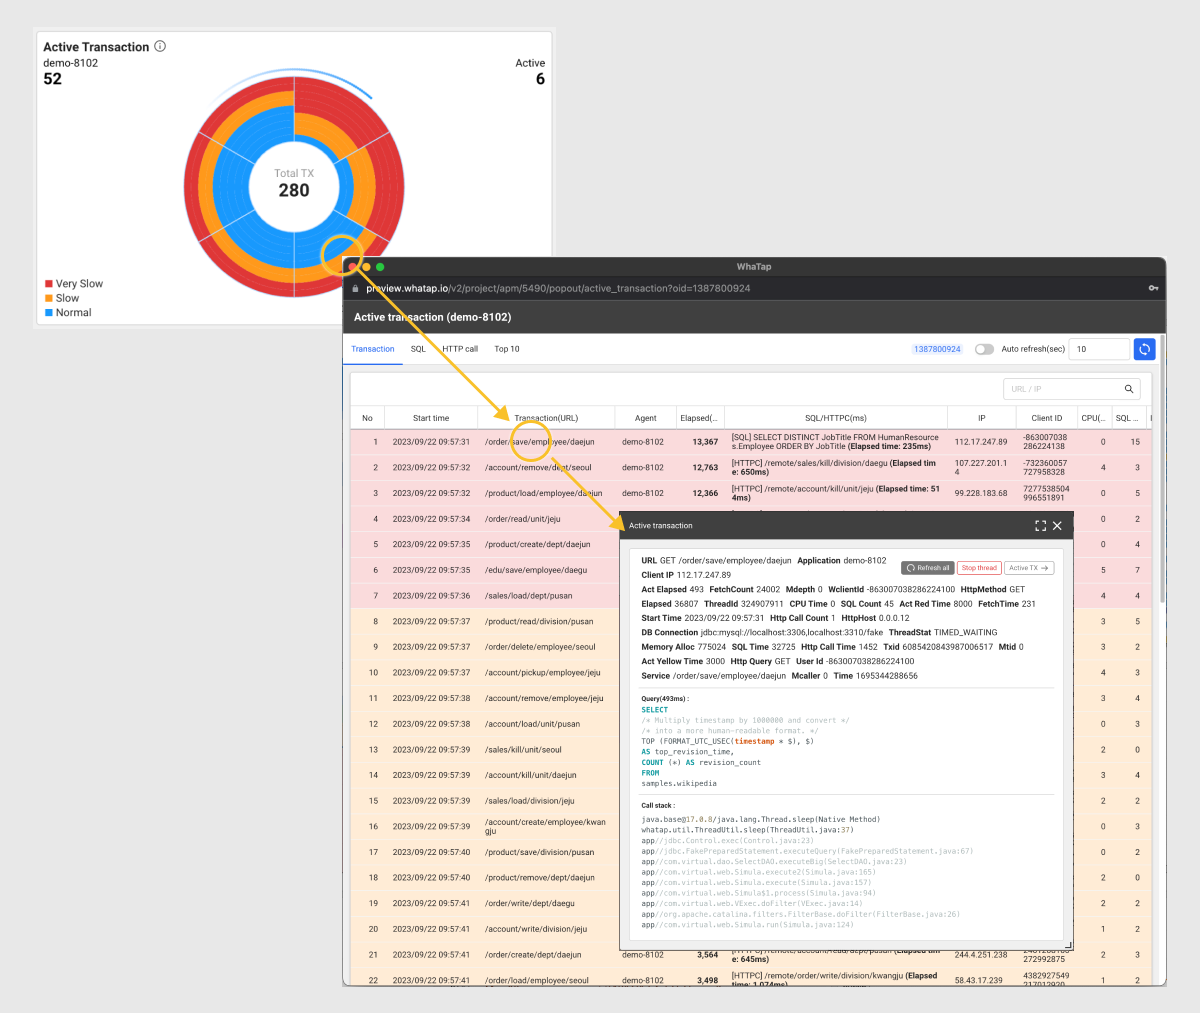
Active Transaction
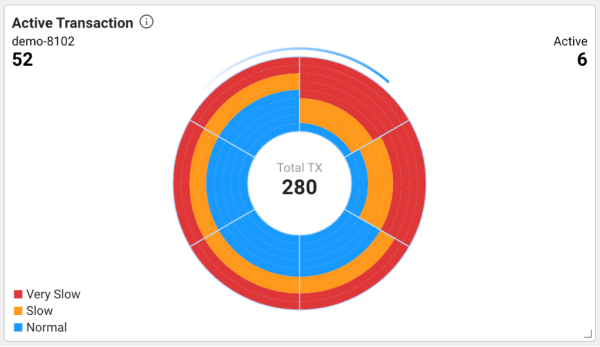
In the Active Transaction widget, the transactions in progress are displayed in the arc equalizer chart. You can see the status of delays by agent. The arc is divided by the number of agents. By representing the number of requests being processed by the server every 5 seconds, you can tell how long the request has been processed. Requests detected at an interval of 5 seconds are classified by color as follows to determine whether they are dangerous or not.
-
Red (Very Slow): 8 seconds or more
-
Orange (Slow): 3 to 8 seconds
-
Blue (Normal): 0 to 3 seconds
The situation where lots of blue colors are represented is not a problem. You must watch the trend to see whether some of them turn to orange or red. In case of a failure, the number of active transactions increases and the percentage of red color increases. On the other hand, a very responsive system with a high number of process transactions (TPS) might have a low number of active transactions.
-
On the upper left, the agent name with the most active transactions appears.
-
The middle number is a sum of active transactions of all agents.
-
Two bars around active transactions rotate around the chart at a three-step rate based on the throughput (TPS).
-
When you select a divided arc area, a pop-up window appears listing the transactions in progress on the agent. To check the transaction details, select an item in the transaction list.
 Note
Note-
If the item selected in the transaction list is a transaction that has already ended, select Show trace. The Transaction information window appears. For more information about the Transaction information window, see the following.
-
For more information about transactions, see the following.
-
Agent Active Transaction
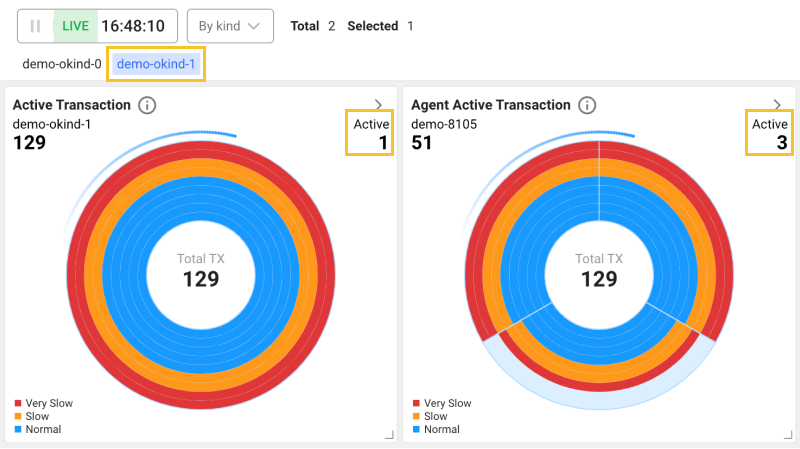
The Active Transaction widget displays on a chart the data merged based on the criteria selected in the agent selection options. On the other hand, the Agent Active Transaction widget allows you to individually check the agents included in the selected agent classification criteria.
Right-click the dashboard and then select the Agent Active Transaction widget from the widget list.
Active status
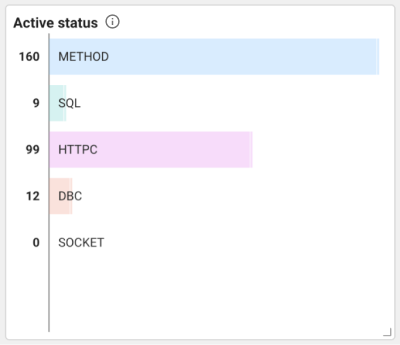
All agents in the project collect the active transaction count every 5 seconds, along with the progress status. The progress status is classified into METHOD, SQL, HTTPC, DBC, and SOCKET.
-
METHOD: Status in which the method is executing. Normal situations are displayed in blue.
-
SQL: SQL is running. If the SQL number increases, check for problems connecting to the database server.
-
HTTPC: It is calling any external API. If the HTTPC number increases, it means that the server connected to outside is not responding normally.
-
DBC: The transaction is attempting to get a new connection from the connection pool. If DB connection pools are insufficient, a delay occurs whenever a new connection request occurs, causing the performance failure. In this case, the DBC number increases.
NoteFor more information about the DB connection delay, see the following.
-
SOCKET: Indicates the TCP connection attempt to an external system. If the SOCKET number continues to increase, there is a high possibility of failures due to disconnection of the external system.
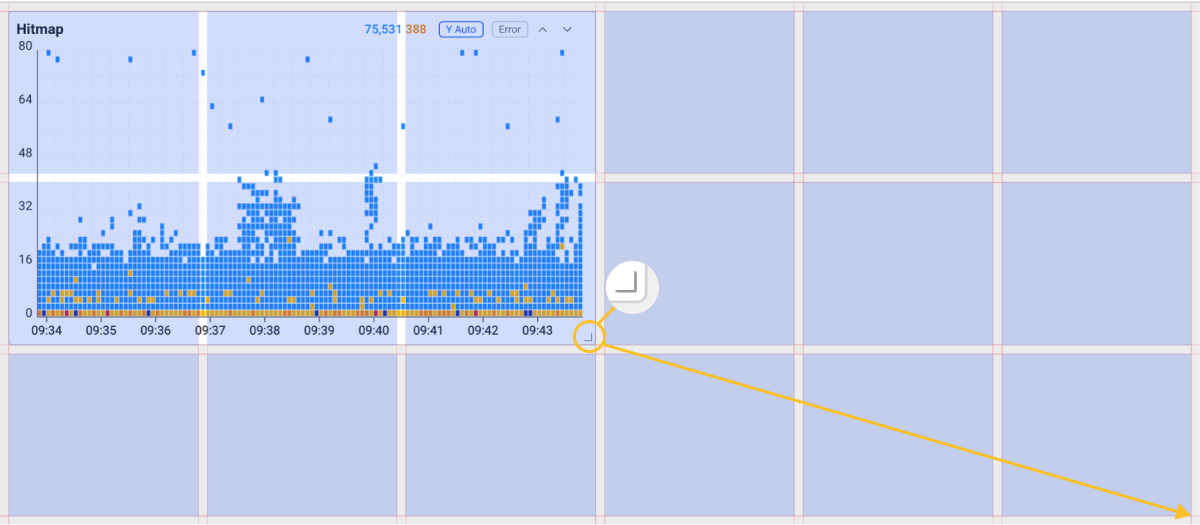
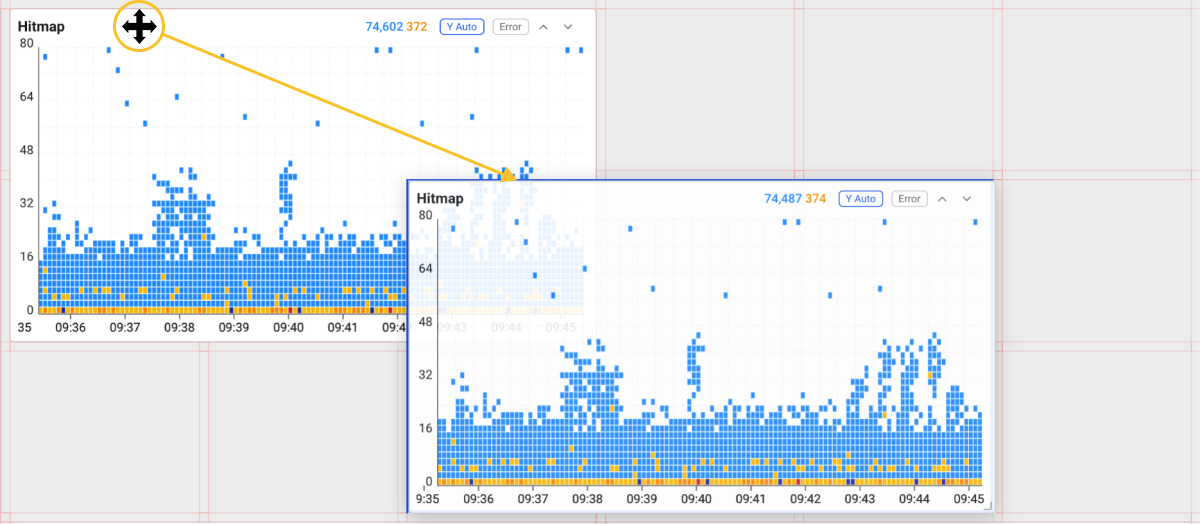
Hitmap
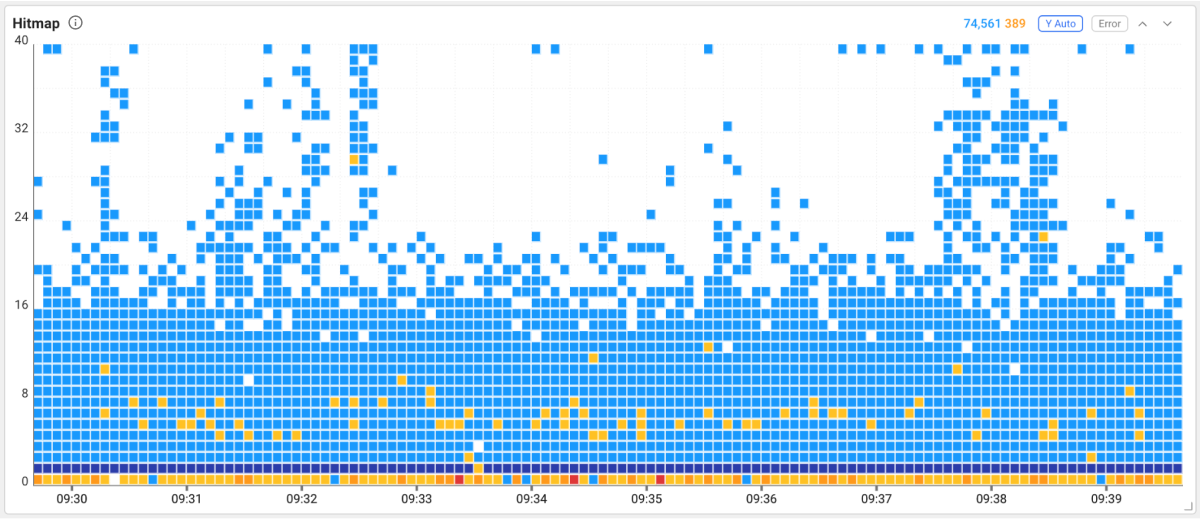
The Hitmap chart represents the distribution of response times of completed transactions. The horizontal axis is the transaction end time. The vertical axis is the execution time. Transactions with longer execution times are at the top of the distribution. If you drag the chart area in Hitmap, the Trace analysis window appears that you can see the transaction information details. For more information about Trace analysis, see the following.
-
Normal transactions are displayed in light blue → blue → Indigo in order.
-
Erroneous transactions are displayed in yellow → orange → red in order.
-
The number on the upper right indicates the transaction count/error count in the chart.
-
If Y Auto is selected, the Y-axis (execution time) is automatically adjusted.
-
If Error is selected, only the error transactions appear.
-
Select
 or
or  to zoom in/out the chart from 5 seconds to 80 seconds.
-
The detailed information for the transactions with no error whose execution time is less than 500 ms is collected once every 5 minutes for each URL.
-
It does not affect the statistics such as TPS and average response time.
-
You can set a policy through the agent configuration. For more information, see the following.
-
See the following document for the procedure to analyze transactions through the hitmap widget.
Active Transaction Equalizer
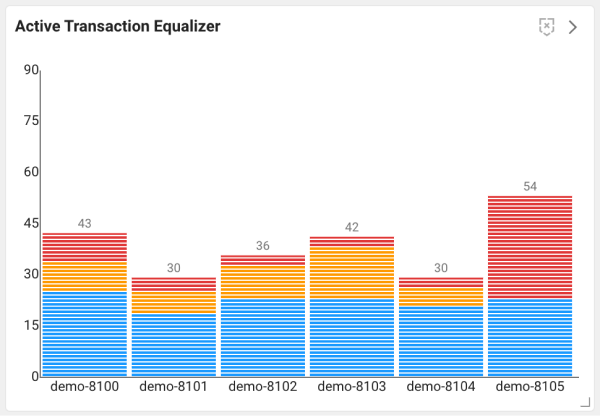
It displays a list of all agents and the total number of active transactions. Hover your mouse over each graph on the chart to display the transaction speed. The transaction speeds are classified into Normal, Slow, and Very Slow.
-
To display or hide inactive agents, select
. -
If you select
 , the Active Transaction menu appears.
Service-related widget
The service-related widget can be used as the metric for application performance tuning.
Apdex
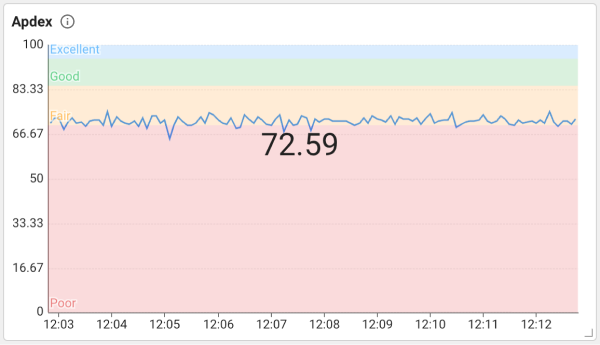
Application Performance Index (Apdex) is the indicator of the application performance. You can measure the customer satisfaction about your web applications. It can be used as an indicator of user satisfaction and the value is between 0 and 1.
(Number of satisfied cases + (Number of tolerating cases * 0.5))/Total number of requests
-
S (Satisfied): No problem in business ≤ 1.2 seconds (Default value)
-
T (Tolerating): Business is possible with any delay ≤ 4.8 seconds (S * 4)
-
F (Frustrated): Business impossible > 4.8 seconds (exceeds T and error)
The default value (S) can be modified in Management > Agent CONFIG.. The value of the setting key is apdex_time. It is available only in the agent 2.0 or later.
TPS
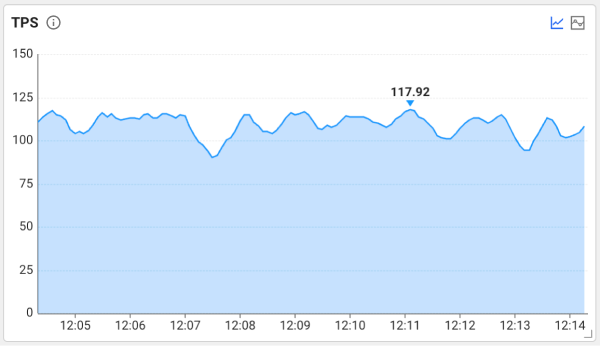
Transaction Per Second (TPS) indicates the number of transactions processed per second and is the reference for service performance metric. The number of transactions processed every 5 seconds is converted to the number of transactions per second and is expressed with a chart. It displays TPS for the last 10 minutes.
For more information about analyses for TPS, response time, and CPU utilization, see the following.
Average Res. time
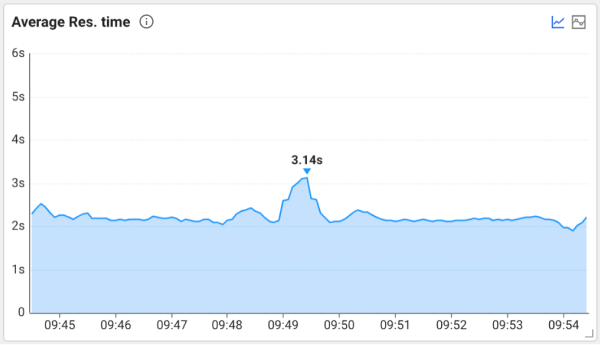
It monitors the times needed for the application server to return the request result. Average Res. time is meaningful as a tuning metric. The WhaTap's monitoring service calculates the average response time for transactions every 5 seconds.
For more information about analyses for TPS, response time, and CPU utilization, see the following.
Resource-related widget
System CPU
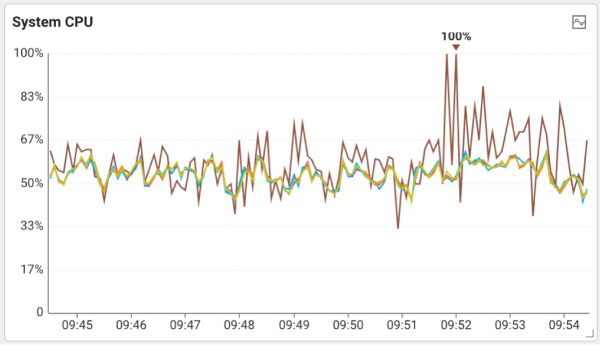
It is the CPU usage of the application server. You can see the change trend in CPU usage in real time.
For more information about analyses for TPS, response time, and CPU utilization, see the following.
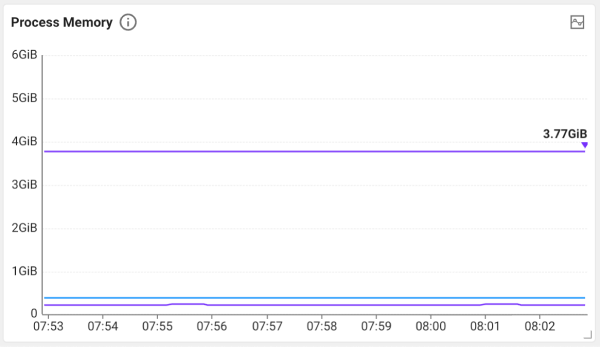
Process Memory
It displays the sum of the maximum system memory available for each server and the memory used by a specified process.
The memory line chart usually ripples continuously. It increases when using memory to process the requests from the application server. It decreases when memory is cleaned up through GC (Garbage Collection). Process Memory metric is displayed with average values.
For more information about chart analysis, see the following link. Monthly WhaTap: Metrics to pay attention to monitoring
User-related widget
Concurrent user
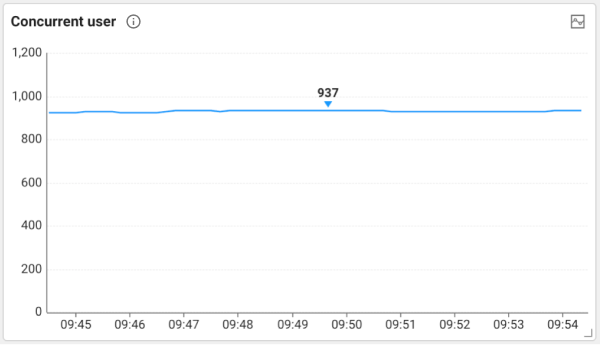
It displays the number of real-time browser users. Every 5 seconds, users who made transactions within the last 5 minutes are counted and displayed without duplicates. Users are counted based on their browser's IP.
-
In general, the connected user means a connected user who has access to the current network. However, web systems are different because they use connectionless networks. It does not mean that you are connected, but rather the user who sent the recent request can be measured.
-
Real-time (concurrent access) users indicate the users who are using the system in the same time zone. There are various ways to count or measure real-time (concurrent access) users.
-
The number of users is calculated by ** HyperLogLog** rather than simply adding up. ** HyperLogLog** is a probabilistic data structure that estimates the number of elements in a set with very little memory.
Comparison widget on a daily basis
The widgets marked with the All APPS. tag display the data for all agents.
Today's TPS
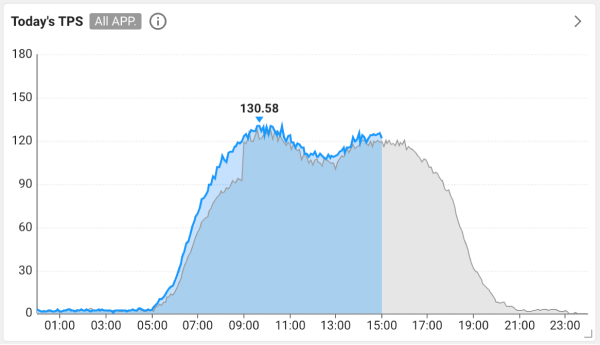
It displays the TPS for today by hour. You can check it by comparing with the TPS (gray) in the same time zone of yesterday. If you click ![]() , Stat/Report > Daily APP. Status appears.
, Stat/Report > Daily APP. Status appears.
Today's visits
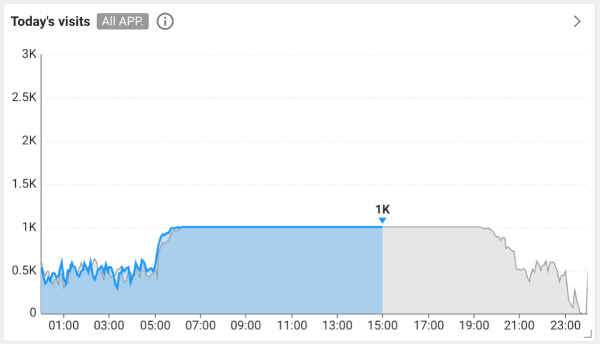
This metric shows the number of Concurrent user for the day by time zone. You can check it by comparing with the user count (gray) in the same time zone of yesterday. If you click ![]() , Stat/Report > Daily APP. Status appears.
, Stat/Report > Daily APP. Status appears.
Checking the real-time alert
If you select ![]() Alert Status on the upper right of the screen, the recent events appear. You can turn on or off the browser notifications by clicking the toggle menu.
Alert Status on the upper right of the screen, the recent events appear. You can turn on or off the browser notifications by clicking the toggle menu.
For more information about basic elements in the fixed menu area at the top of the screen, see the following.