CUBE
Home > Select Project > Analysis > Cube
It provides information for connections, hitmap, transactions, TOP transactions, TPS, response times, and resource usage for each country.
-
See the application performance trends over time. You can quickly identify the changes in application performance by using statistical data at an interval of 5 minutes.
-
You can see the geographic distribution of the traffic. Through the traffic data for applications, you can see the geographic distribution of traffic data and compare the performances across regions.
-
You can see the usage of resources. You can see the usage of resources used by applications and analyze the causes of poor performance.
What is Cube?
We call the performance statistics generated every 5 minutes as Cube. Cube analysis uses each 5-minute performance data stored in cubes.
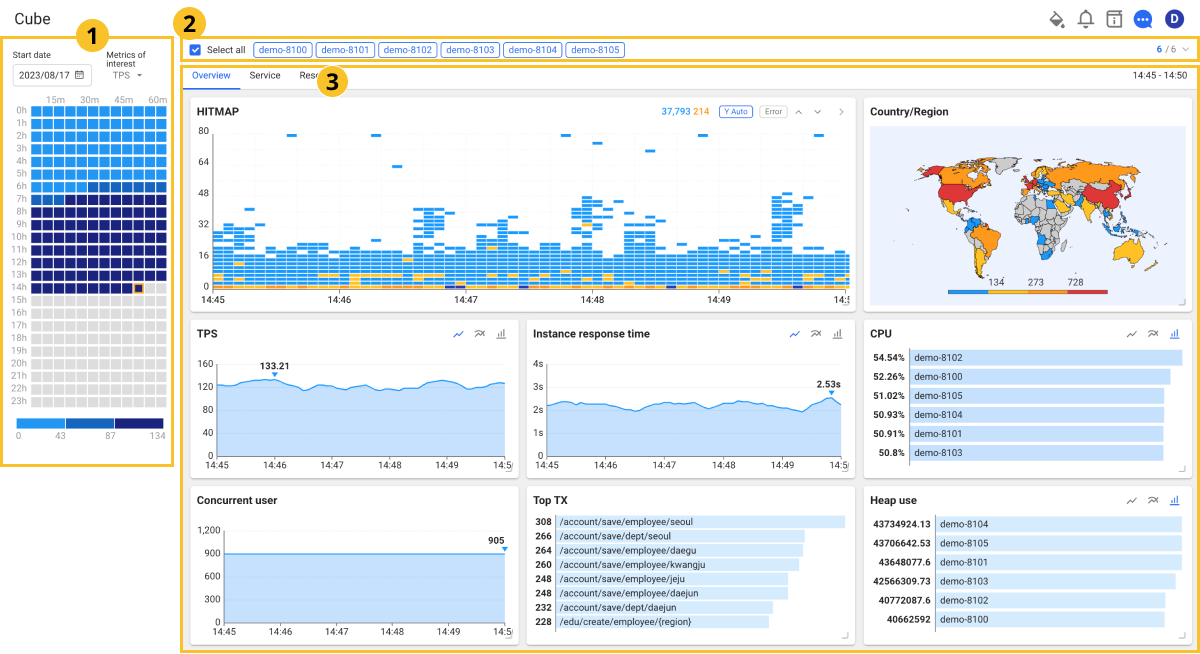
 Cube selection panel
Select a cube based on the specific time in the cube selection panel in the left ![]() area. Because the cubes are stored every 5 minutes, select a specific time.
area. Because the cubes are stored every 5 minutes, select a specific time.
-
Panel interest metric
- TPS
- Response time
- TX error count
- Active TX count
- Concurrent user
-
Cube color
The cubes are displayed in different colors depending on the number of the selected metrics.
-
Dark blue: high figure
-
Light blue: low figure
-
 Application selection
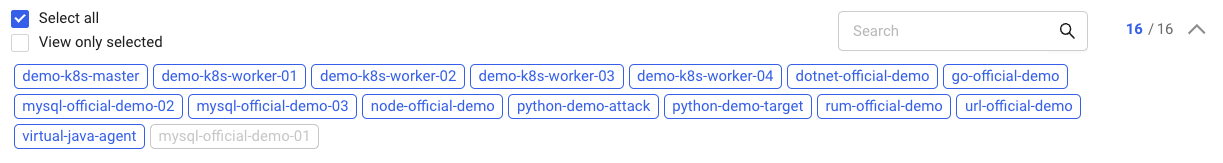
You can select data for a specific application through the application selection option in the top ![]() area. If you select
area. If you select ![]() on the right, you can see all the applications that can be selected as follows.
on the right, you can see all the applications that can be selected as follows.
-
Select all: All applications are viewed. By default, Select all and Active application are selected.
-
Active application: Among the applications, the active applications are specified for inquiry.
-
View only selected: Among the applications, only the specified applications are queried.
-
Search: If there are many applications, you can search for them through the input field.
-
Number/Number: Displays the number of applications specified/number of all applications.
 Cube data
In the area of ![]() , the cube data can be checked through the charts for Hitmap, Country/Region, TPS, Instance response time, CPU, Concurrent user, Top TX, and Heap use.
, the cube data can be checked through the charts for Hitmap, Country/Region, TPS, Instance response time, CPU, Concurrent user, Top TX, and Heap use.
-
Hitmap
It displays the distribution of transactions over the cube time. Detailed trace analysis is possible.
-
Country/Region
By mapping countries based on the client IP, it displays from which country the transactions are coming. The colors on the map display the relative amount of transactions.
NoteWhaTap basically stores the client-related information. For more information about the agent settings for user data collection, see the following.
-
TPS
Transaction Per Second (TPS) means the number of transactions processed per second.
-
Instance response time
Average response time for transactions
-
CPU
After sorting the project applications (agents) by the IP, it displays CPUs of the busy server with a bar chart.
-
Concurrent user
It displays the number of real-time browser users.
-
Top TX
It displays 5 transactions of high invocation. Transaction statistics provide more detailed data.
-
Heap use
Among the applications (instances), the instances are displayed in order of heap memory usage.
- If you select the
 icon on the upper right of the chart, merged line charts are provided.
 - If you select the
 icon on the upper right of the chart, individual line charts are provided.
 - If you select the
 icon on the upper right of the chart, the bar-type chart appears.
WhaTap uses the IP2Location LITE database for IP geolocation.