Multiple transaction trace
Multi-transaction means the transaction involving a different agent or project. Multiple Transaction Trace is to trace calls between the application services registered in the WhaTap project.
Enabling the multi-transaction
To trace multi-transactions, set the mtrace_enabled option to true in Management > Agent CONFIG.. For more information about the agent configuration, see the following.
Checking the multi-transaction ID
To use the Multiple Transaction Trace menu, MTID (Multi Transaction ID) is required. Through the following procedure, you can find the MTID value.
-
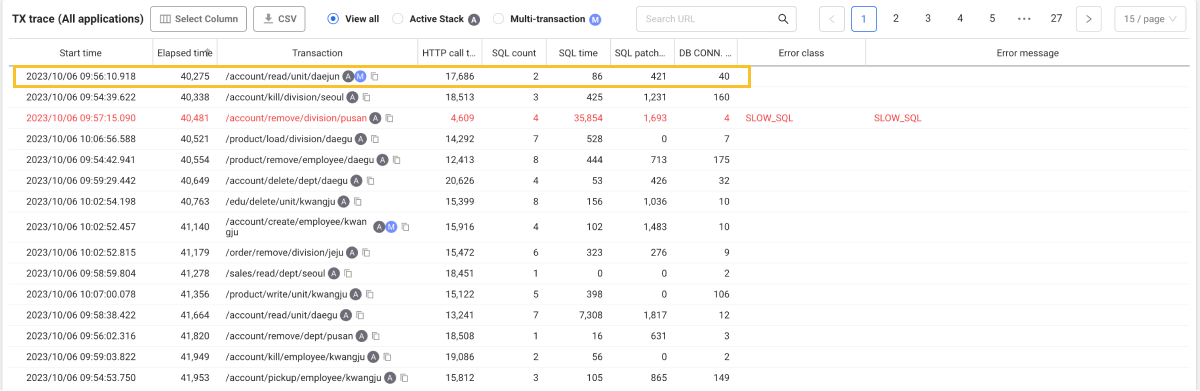
In Analysis > Hitmap, drag the chart area.
-
The transaction information in the dragged chart area is displayed in the TX trace list below as follows.
-
If you select the trace with the
 icon displayed, the Transaction information window appears.
 -
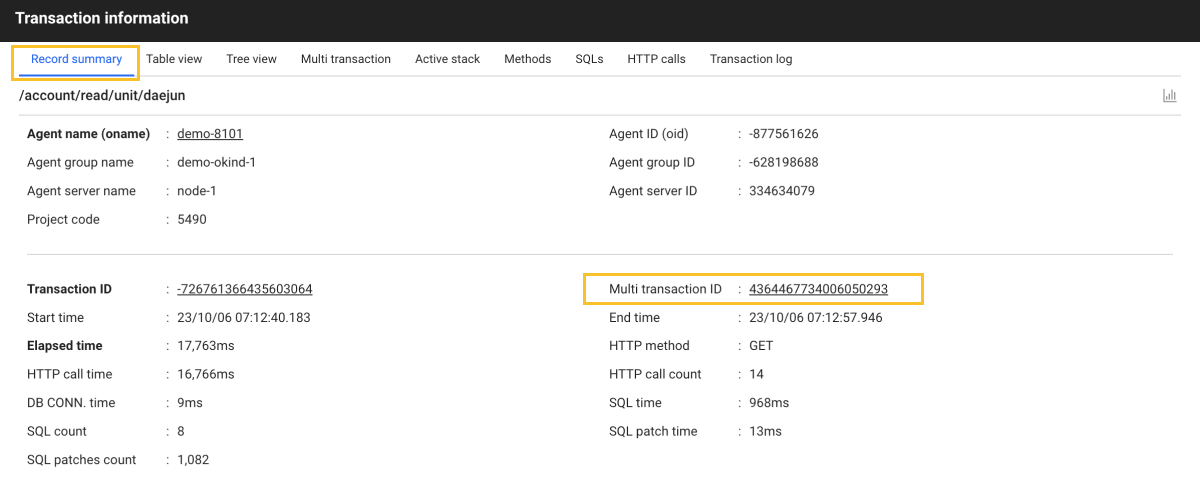
In the Record summary tab, you can see the Multi transaction ID value.
-
The same Multi transaction ID is generated even if the transaction makes an external call. Even if projects are separated by service, all transactions between applications can be found through the initially issued Multi transaction ID. For more information about the detailed analysis of transaction trace through the Transaction information window, see the following.
-
If you select Multi transaction ID in the Transaction information window, the Multi transaction tab appears. The transactions and trace data are provided so that you can see various call relationships at a glance within or between systems, and identify where problems occurred for improvement.
Using the multi-transaction tracing feature
-
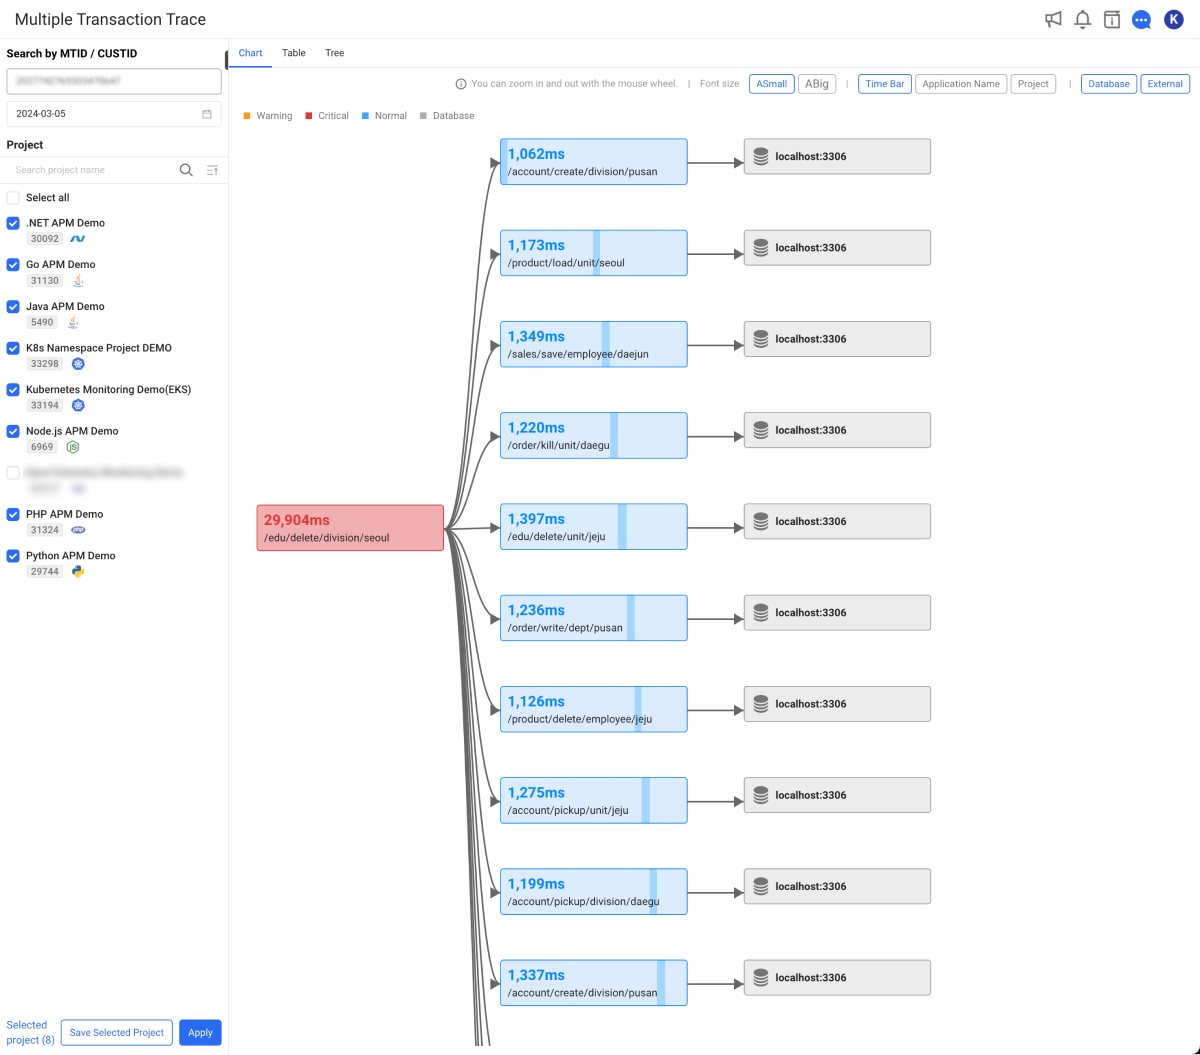
Go to Analysis > Multiple Transaction Trace.
-
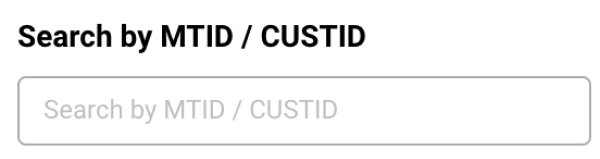
Enter the MTID value seen in Transaction information window in Search by MTID / CUSTID.
-
Select the date and project to view.
-
At the bottom of the screen, select Apply.
The Chart tab on the right displays a diagram that helps you find the call relationships for each transaction.
The Apply button at the bottom of the screen is disabled in the following situations:
-
In case you set the same filter values (MTID/CUSTID, date, selected project) as in the previous search
-
In case any of the filter values (MTID/CUSTID, date, selected project) is not entered
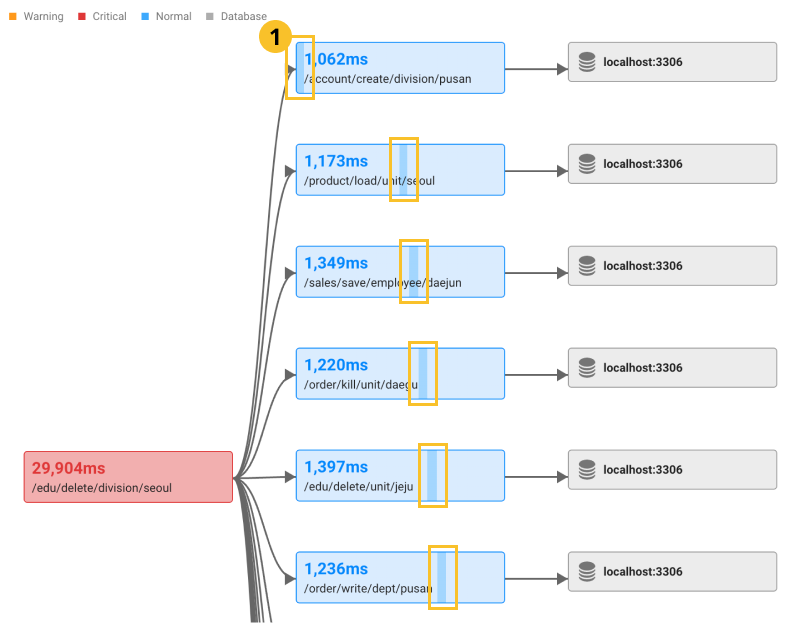
Chart
The Chart quickly and clearly provides users with the call relationship between transactions. The execution times for each individual transaction service with the same Multi transaction ID can be viewed. You can see the call relationship between transactions through the elapsed time (![]() Time Bar) represented with the background color of the transaction node. In Chart, you can use the mouse to go to a desired position or zoom in or out by scrolling.
Time Bar) represented with the background color of the transaction node. In Chart, you can use the mouse to go to a desired position or zoom in or out by scrolling.
If you select a transaction node, an additional Transaction information window appears as follows. The transaction trace allows you to see the transaction details. For more information about the detailed analysis of transaction trace through the Transaction information window, see the following.
-
ASmall / ABig: The size of the font displayed on the node can be adjusted.
-
Time Bar: You can display or hide the step times (Time Bar) for each node.
-
Application Name: You can display or hide the agent names (oname) for each node.
-
Project: You can display or hide the project names for each node.
-
Database / External / Internal: Connection requests for other databases or HTTP calls that occurred in the transaction can also be viewed through the nodes of the chart.
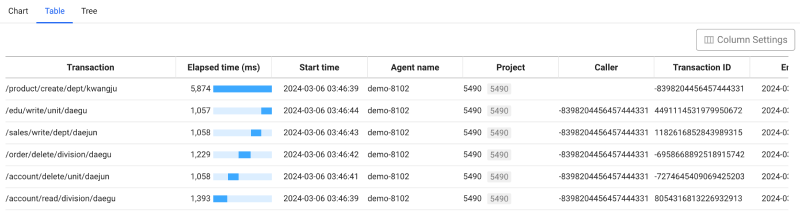
Table
In the Table tab, you can see information for each transaction included in a multi-transaction in the table format.
If you select each transaction, the Transaction information window for the selected transaction appears, similar to selecting a node on the Chart tab. The transaction trace allows you to see the transaction details. For more information about the detailed analysis of transaction trace through the Transaction information window, see the following.
![]() Column Settings: You can edit the columns in the table.
Column Settings: You can edit the columns in the table.
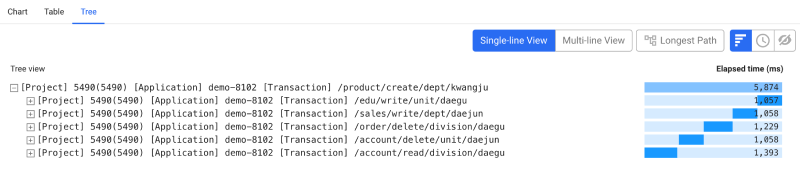
Tree
In the Tree tab, you can see each transaction and its trace details. The transactions within the overall transaction time or start times and step times of each trace to provide transaction call relationships in a tree format.
-
 Single-line View: You can arrange the tree format at intervals by displaying the texts displayed in the execution data for each section in a single line.
 -
 Multi-line View: All the texts displayed in the execution data for each section, appear by wrapping words.
 -
Longest Path: The longest route can appear.
-
 Show Time Bar: The elapsed times are displayed in a bar chart.
 -
 Show Time: The timestamps, gaps, and elapsed times for each segment are displayed in text.
-
8 seconds or more: Excessive delay state is distinguished in red.
-
Between 3 and 8 seconds: Delay state is distinguished in orange.
-
Less than 3 seconds: Normal state is distinguished in blue.
NoteIn case of start and step times, the time differences caused by the transaction call environment are corrected on the screen through traces and mappings in the parent transactions. Accordingly, there may be differences from the actual time data.
-
-
 Hide Time: The time is hidden.
If you select ![]() button or
button or ![]() button, you can see the summary window such as HTTP call statistics and Active stack.
button, you can see the summary window such as HTTP call statistics and Active stack.
To search SQL variables and HTTP queries, add the following options to the agent settings.
-
For agent settings related to recording SQL parameters, see the following.
-
For agent settings related to recording the HTTP parameters, see the following.
# SQL parameter lookup option: If the option is applied, SQL parameters are collected after being encrypted.
profile_sql_param_enabled=true

// HTTP parameter lookup option: If the option is applied, HTTP query parameters are collected after being encrypted.
profile_http_parameter_enabled=true