MSA Analysis
What is the MSA analysis?
The MSA analysis function analyzes the proportion of calls between transactions collected through the WhaTap's Multiple transaction trace function. Based on this, dependencies between microservices can be checked at the URL level rather than instance-centric basis.

For example, there are five microservices: A, B, C, D, and E. If a user calls A, it is assumed that the following three call patterns occur according to the logic.
- A→B, C calls
- A→B, C calls + then B→D call
- A→B, C calls + then B→D, E calls
If these three patterns have been performed once, MSA analysis can check the association analysis data depending on the reference URL.

For more information about multiple transaction trace, see the following.
MSA Transaction Statistics
Home > Select Project > ![]() Sitemap > Analysis > MSA Analysis
Sitemap > Analysis > MSA Analysis
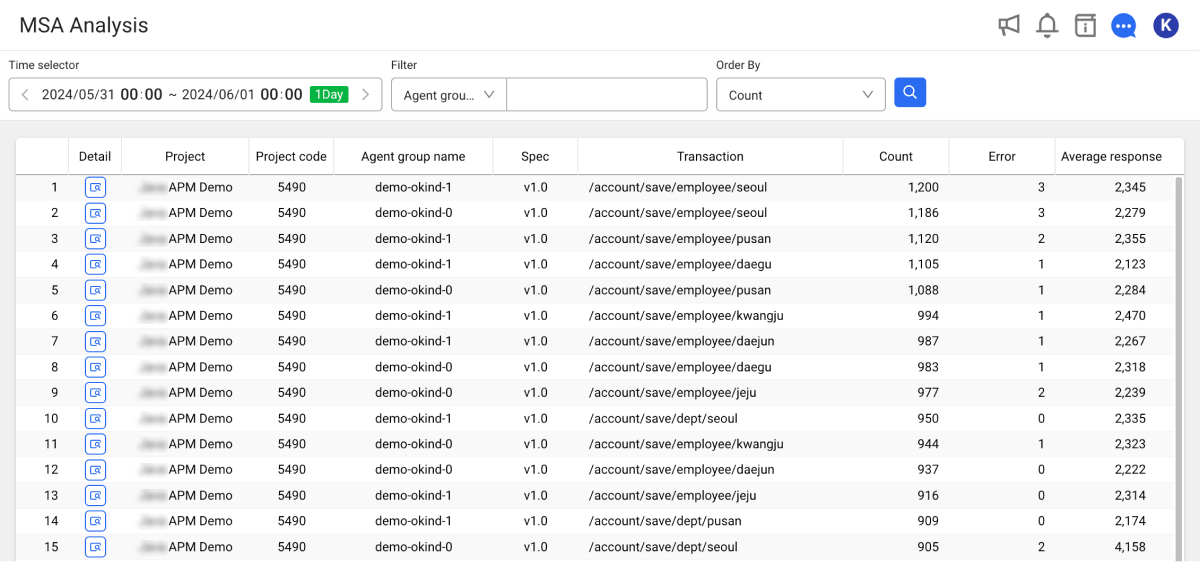
The MSA Analysis menu is a tool that can effectively analyze the performance and stability for each service in the microservice environment. By analyzing the detailed call relationships for transactions, you can optimize the system performance and proactively identify potential problems based on the analysis.
-
Time selector: Select a desired search period. You can view a list of transactions including callers and callees on a daily basis.
-
Filter: By filtering based on Agent group name, Spec, and Transaction, you can perform the search.
-
Order By: Based on Count, Error, and Time avg (average response time), the list can be sorted.
-
The time range that can be searched in Time selector is up to 1 day (24 hours). For more information on how to use the Time selector option, see the following.
-
Agent group name is the group name classified as
whatap.okindin the agent configuration options. -
After setting the conditions, select
 to update the transaction list.
Analyzing in detail
When you select ![]() for the item to view in the transaction list, the Display Detail window appears. You can view the caller and callee for the transaction in the Display Detail window.
for the item to view in the transaction list, the Display Detail window appears. You can view the caller and callee for the transaction in the Display Detail window.
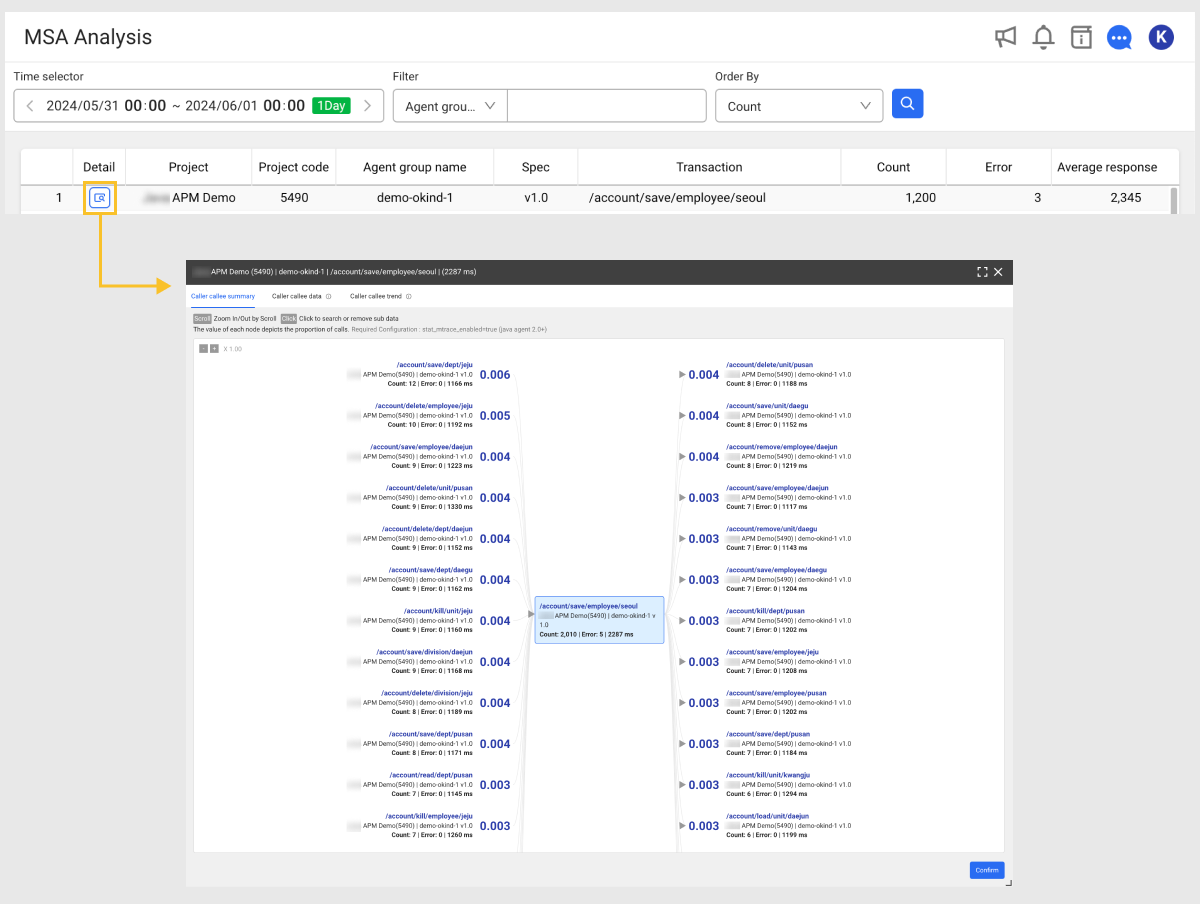
Each tab provides the following analysis features:
-
Caller callee summary: It provides a visualized diagram for the relationship between the caller and callee of the transaction.
-
Caller callee data: It provides the details of the transaction such as call count, error count, and response time.
-
Caller callee trend: It provides a time series chart for performance changes in the number and rate of transaction calls over time.
-
You can view it in full screen when the
 button is selected on the upper right of the Display Detail window.
 -
To close the Display Detail window, select Confirm at the lower right or press the ESC key.
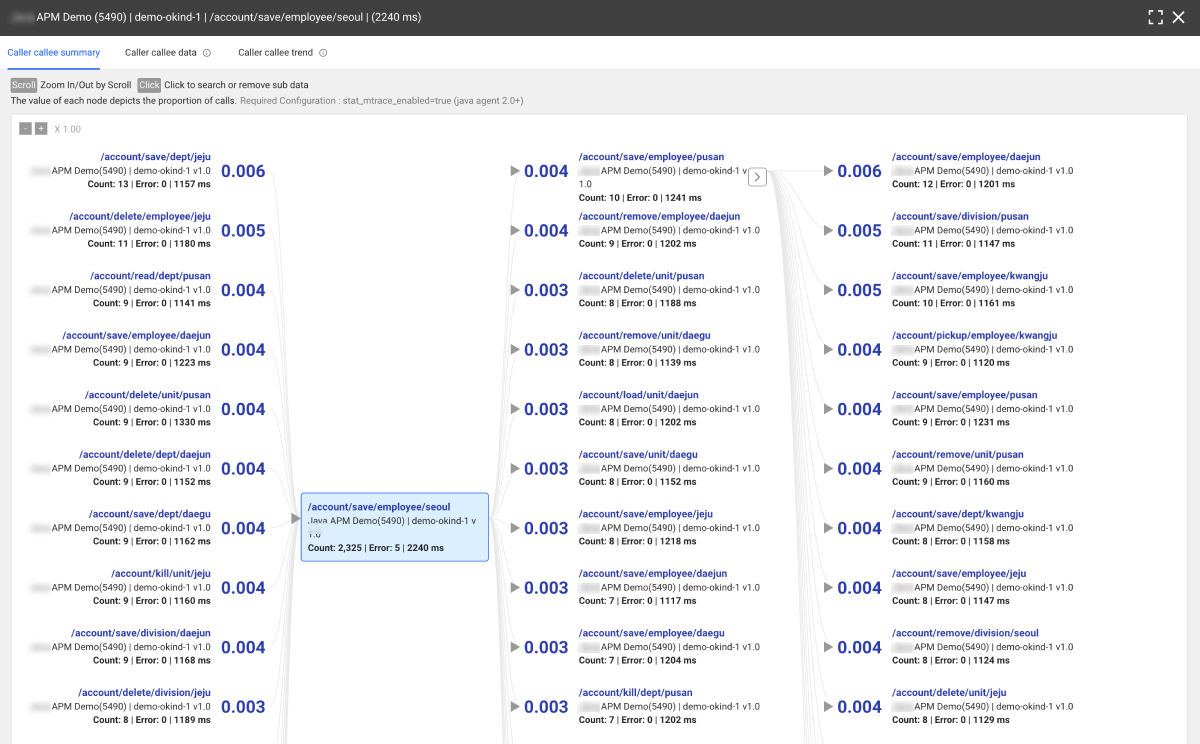
Caller callee summary
The Caller callee summary tab displays the dependency between the caller and callee of a transaction selected from the transaction list in a visualized diagram. You can intuitively understand the call relationships between services. Call paths and dependencies can be visually identified, which is advantageous for analyzing the causes of problems.
Analyzing call relationships
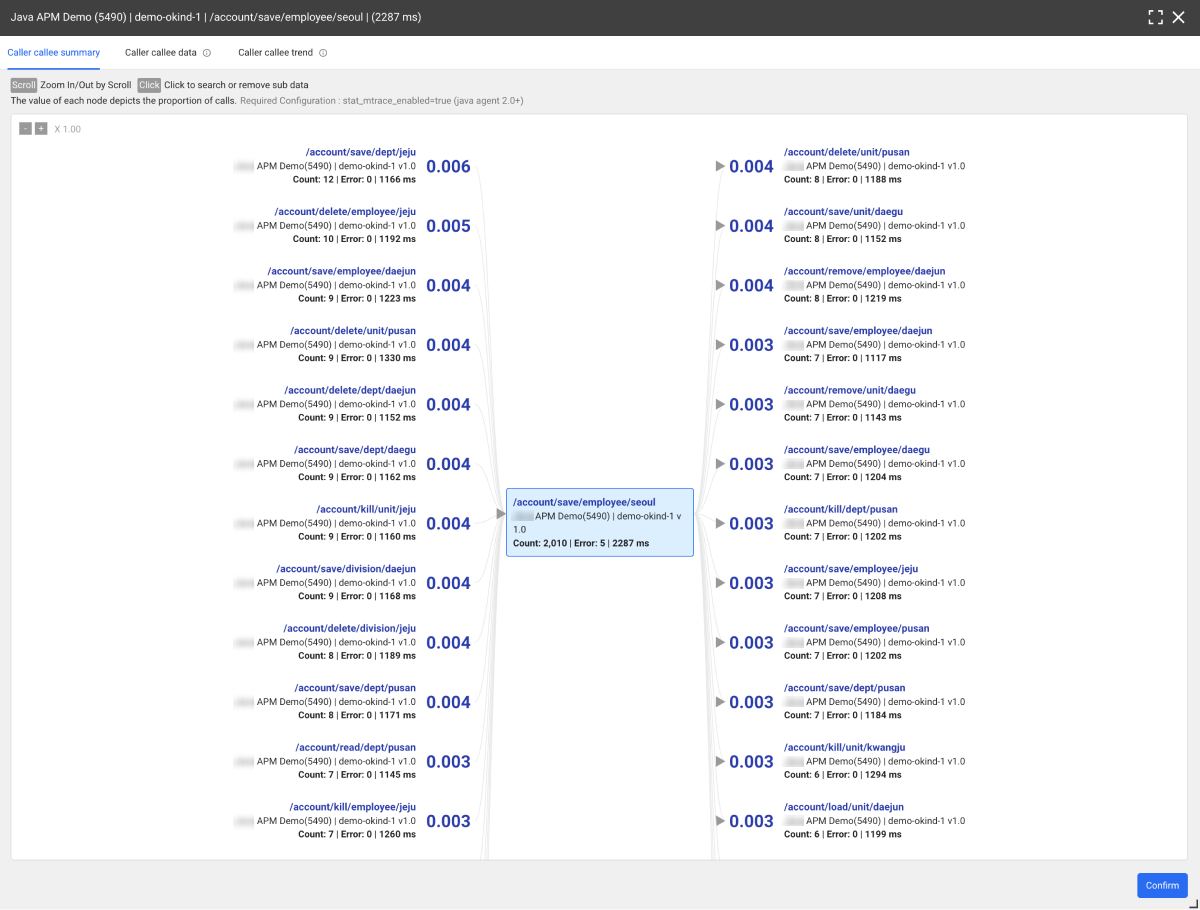
Caller and callee nodes display numerical data whose maximum is 1 such as 0.004 and 0.003, which represents its proportion among all callers. Likewise, the weight of each callee is displayed together on the right.
Through the above screen, you can analyze the dependencies between callers and callees based on the /account/save/employee/seoul transaction. You can visually see from and to which services the transactions are called.
Checking the performance metrics
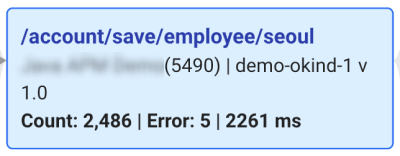
Each node consists of a transaction URL, project name, agent group name, and the following performance data:
-
Count: Number of calls for the transaction
-
Error: Number of errors occurred for calls
-
Average response time: Average response time for the transaction, in milliseconds (ms)
Finding the transaction flow
When you hover your mouse over a caller or callee node, the ![]() button appears. If you select this button, it expandes into subnodes. By checking the entire flow of transactions, you can get answers in finding where problems occur.
button appears. If you select this button, it expandes into subnodes. By checking the entire flow of transactions, you can get answers in finding where problems occur.
-
To close the subnodes, select
 again.
 -
You can enlarge or reduce the screen using the scroll feature of the mouse. Or click the +/- buttons on the upper left of the screen.
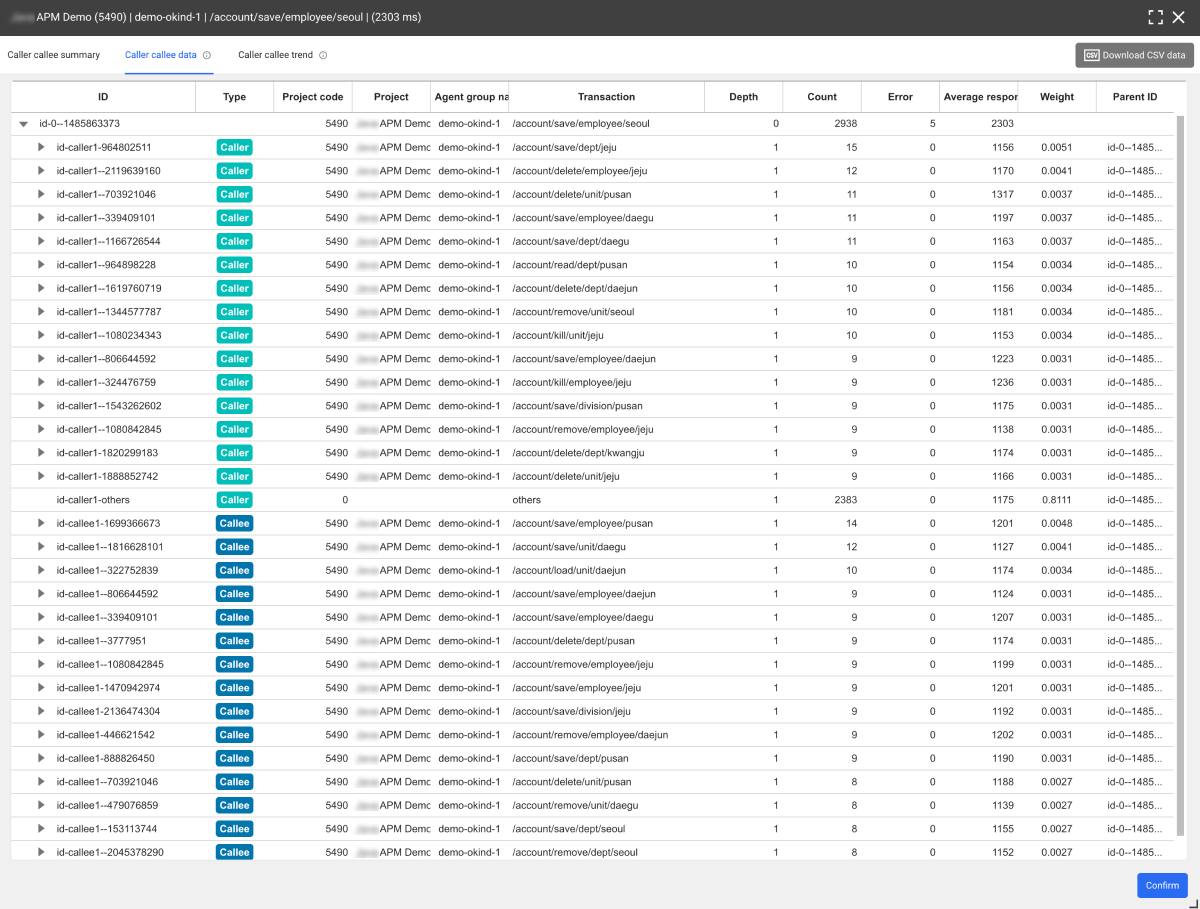
Caller callee data
The Caller callee data tab displays the correlation between caller and callee for the reference URL (e.g. /account/save/employee/seoul) in a tabular format. You can specifically check the details of each transaction (call count, error count, average response time, etc.), enabling a precise, data-based analysis.
-
It can be used to analyze performance issues by checking the number and rate of calls, number of errors, and average response time of each transaction.
-
Through the Type column, you can easily distinguish between caller and callee and find the call relationship.
-
By selecting
 for each transaction, you can additionally check the transactions related to the transaction.
 -
To save the data list in CSV format, select Download CSV data at the upper right.
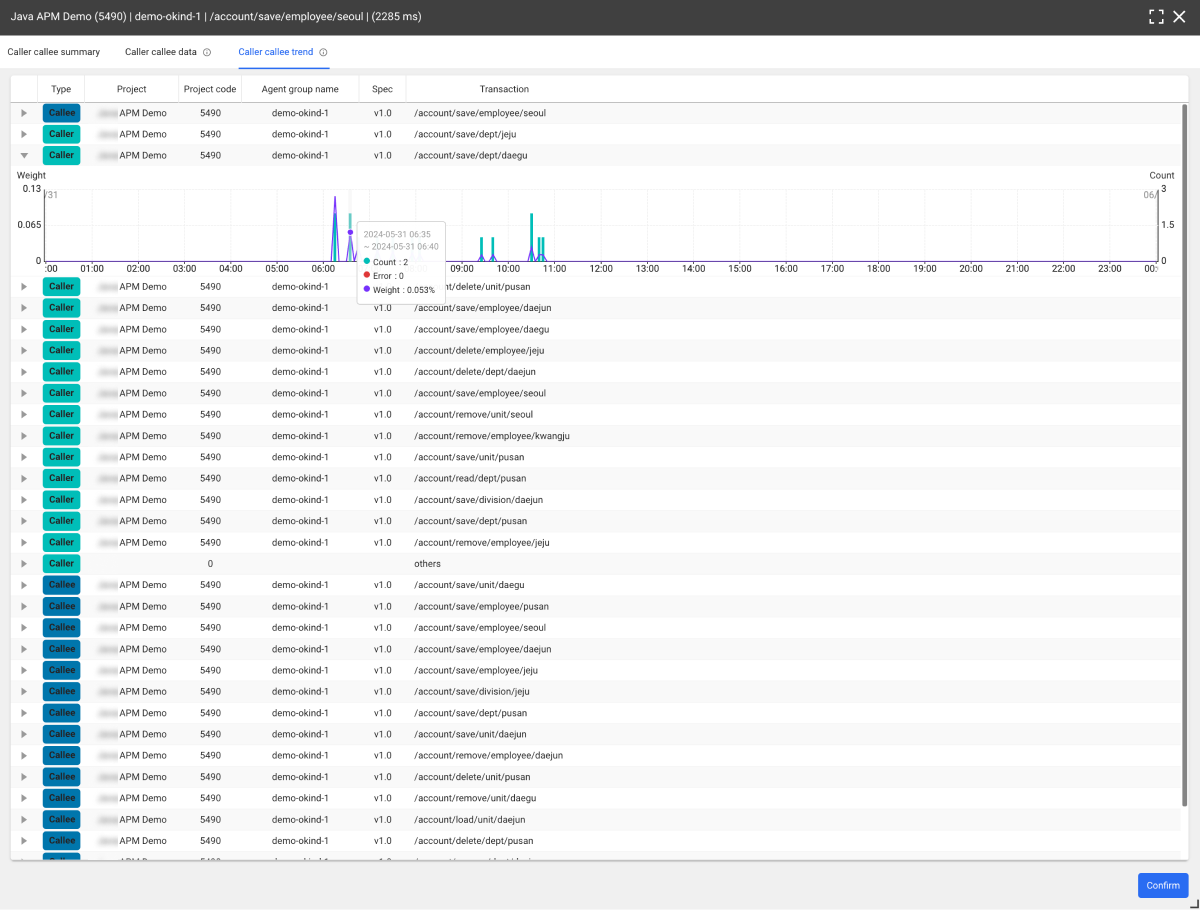
Caller callee trend
The Caller callee trend tab allows you to visually analyze the call relationships and performance data of the reference URL (/account/save/employee/seoul) over time. This can help you find the pattern in the performance of transactions.
-
You can see performance changes at a glance by visualizing the number and ratio of calls for specific transactions on a graph over time.
-
Through the Type column, you can easily distinguish between caller and callee and find the call relationship.
-
When you hover your mouse over the time series chart, you can see the numerical data through the tooltip.
-
When you click a specific time zone on the chart, the Analysis > Transaction Search menu appears. You can view a list of transactions in the selected time zone.