UI 사용 안내
와탭 모니터링 서비스의 개별 메뉴에서 공통으로 사용되는 User Interface(UI) 요소의 사용 방법을 안내합니다. 공통 UI 요소는 메뉴 간의 통일성을 유지하고, 사용자가 빠르고 직관적으로 원하는 기능을 이용할 수 있도록 설계되었습니다. 또한 일관되고 효율적인 사용자 경험을 제공합니다. 이 문서를 통해 와탭 모니터링 서비스의 모든 기능을 보다 쉽게 이해하고, 효율적으로 활용하길 바랍니다.
시간 선택자(타임 셀렉터)
사용자가 필요한 데이터를 빠르고 정확하게 분석할 수 있도록 날짜와 시간을 설정할 수 있는 기능을 제공합니다. 시간 선택자의 주요 기능과 사용 방법을 안내합니다.
실시간 모드
대시보드 데이터를 실시간으로 갱신하여 현재 시점의 상태를 확인할 수 있는 모드입니다. 사용자가 보고 있는 메뉴가 실시간 모드이면 화면 상단의 날짜 및 시간 선택 도구에는 ![]() Live가 표시됩니다.
Live가 표시됩니다.
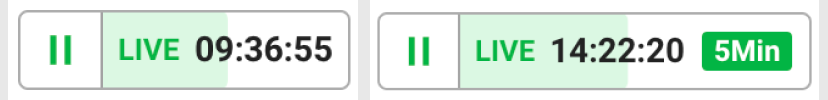
실시간 모드에서는 데이터를 기본 5초 간격으로 수집하여 화면에 표시합니다. 시간 선택자에 녹색 아이콘(예, 5 Minutes)이 표시되어 있다면, 데이터는 해당 조회 구간 동안 5초 데이터를 갱신합니다.
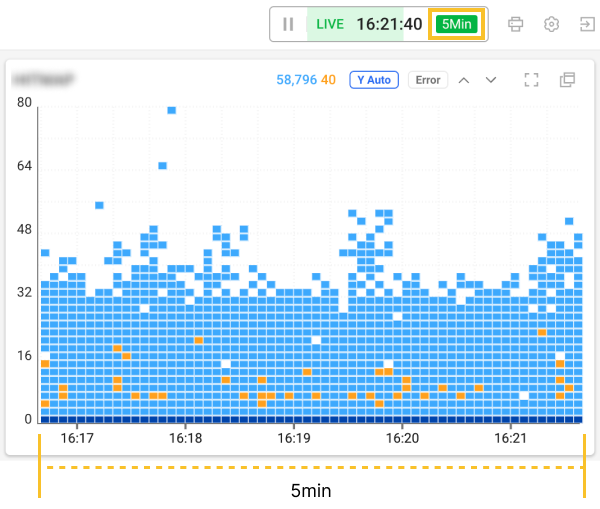
예를 들어, 시간 선택자에 5 Minutes이 표시되어 있다면, 화면에 표시된 차트 또는 데이터는 5분 동안의 데이터를 5초 간격으로 계속 갱신합니다.
-
녹색 아이콘 버튼을 선택하면 데이터 조회 구간을 변경할 수 있습니다.
-
실시간 모드를 멈추고 특정 시각의 데이터를 조회하길 원한다면
 버튼 또는 시계 영역을 선택하세요.
제공하는 메뉴와 기능에 따라 실시간 모드를 지원하지 않을 수 있습니다.
기간 설정 모드 (과거 시간 조회)
사용자가 원하는 시작 시간과 종료 시간을 설정하여 해당 기간의 데이터를 조회할 수 있는 모드입니다. 실시간 모드로 돌아가려면 ![]() 버튼을 선택하세요.
버튼을 선택하세요.
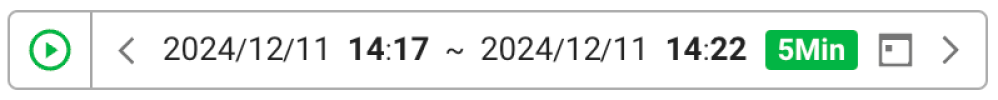
과거 시간을 조회하려면 ![]() 버튼 또는 날짜, 시간 영역을 선택해 원하는 조회 기간을 설정할 수 있습니다.
버튼 또는 날짜, 시간 영역을 선택해 원하는 조회 기간을 설정할 수 있습니다.

제공하는 메뉴 및 기능에 따라 조회할 수 있는 최대 기간은 다를 수 있으며, 실시간 모드(![]() )를 지원하지 않을 수 있습니다.
)를 지원하지 않을 수 있습니다.
특정 날짜와 시간 선택하기
원하는 날짜와 시간을 선택해 해당 시간의 데이터를 조회할 수 있습니다.
키보드로 변경하기
날짜 또는 시간 영역을 클릭한 다음 키보드를 이용해 시간을 변경할 수 있습니다.
-
키보드의 왼쪽 또는 오른쪽 방향 키를 누르면 년, 월, 일, 시간, 분 단위로 이동할 수 있습니다.
TAB또는shift + TAB키를 눌러 이동할 수도 있습니다. -
키보드의 위 또는 아래 방향 키를 누르면 원하는 날짜 또는 시간으로 변경할 수 있습니다.
-
키보드를 이용해 시간을 변경한 후
Enter키를 입력하거나 시간 선택자 외부를 클릭하세요. 입력 중ESC키를 입력하면 변경 사항은 적용되지 않습니다. -
기간 설정 모드에서는
 또는
또는  버튼을 선택해 원하는 조회 기간을 변경할 수 있습니다. 이때, 변경되는 시간 단위는 녹색 아이콘에 표시된 값 기준입니다.
달력에서 변경하기
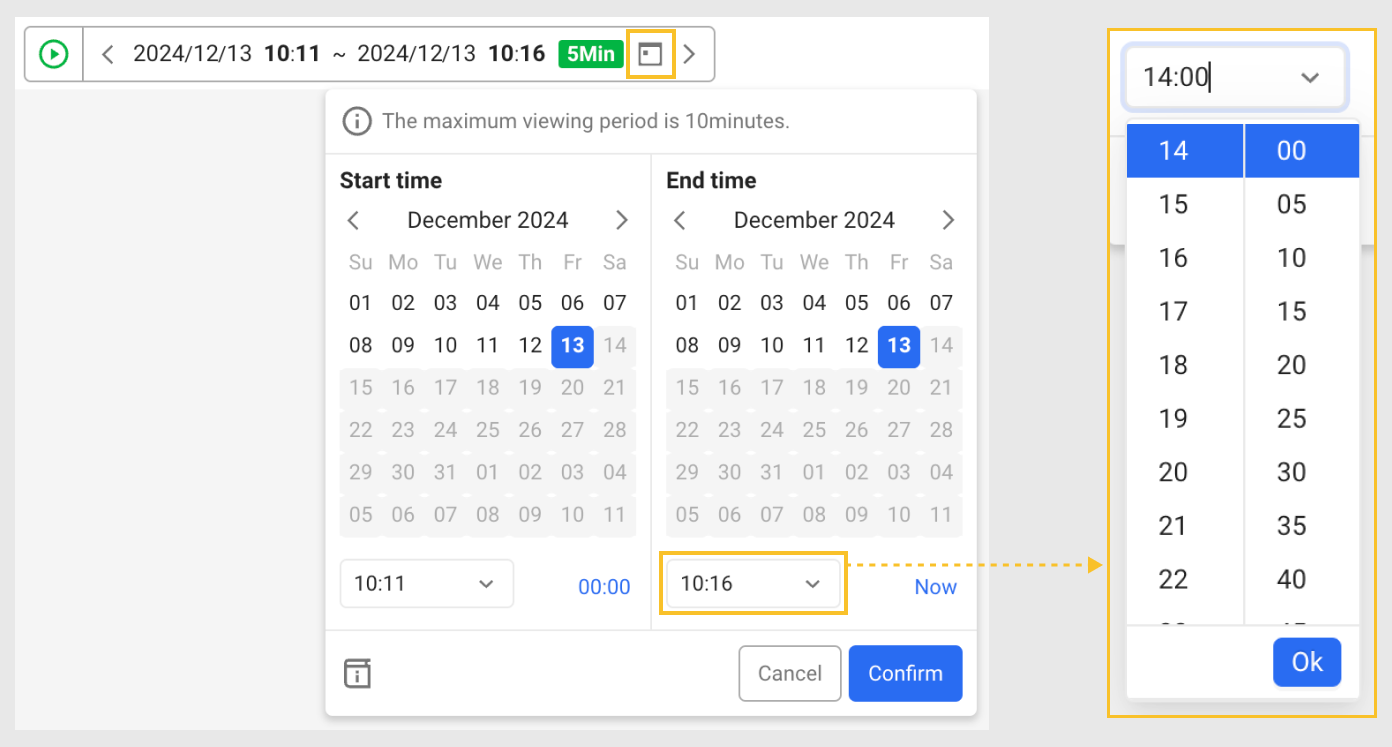
시간 선택자의 가장 오른쪽에 ![]() 버튼을 선택하세요. 달력과 시간을 선택할 수 있는 창이 나타납니다. 원하는 날짜와 시간을 선택해 변경할 수 있습니다. 날짜와 시간을 변경한 후 Confirm 버튼을 선택하세요.
버튼을 선택하세요. 달력과 시간을 선택할 수 있는 창이 나타납니다. 원하는 날짜와 시간을 선택해 변경할 수 있습니다. 날짜와 시간을 변경한 후 Confirm 버튼을 선택하세요.
-
달력 상단의
또는 버튼을 선택해 월 단위로 달력을 변경할 수 있습니다. -
달력 하단의 시간 선택 상자에서 원하는 시간을 선택할 수 있습니다. 시간을 선택한 후 Confirm 버튼을 클릭하세요.
-
Now 버튼을 선택하면 현재 시각으로 변경할 수 있습니다.
-
회색으로 표시된 날짜는 선택할 수 없습니다.
-
 버튼을 선택하면 현재 문서 페이지로 이동합니다.
 -
제공하는 메뉴 및 기능에 따라 최대 조회 기간은 다를 수 있습니다.
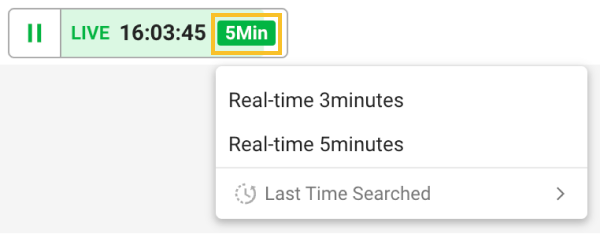
사전 정의된 조회 범위 선택하기
빠르고 효율적으로 데이터를 조회할 수 있도록 사전 정의된 조회 범위를 선택할 수 있는 기능을 제공합니다. 시간 선택자에서 녹색 버튼을 선택하세요.
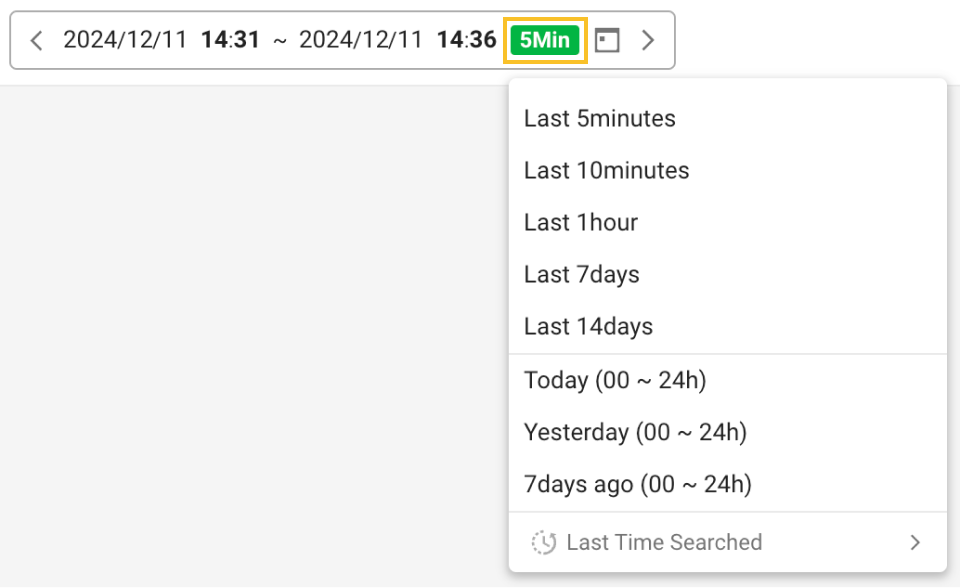
단기 조회부터 중기 조회, 특정 날짜 기반으로 선택할 수 있는 옵션을 제공합니다. 원하는 옵션을 선택하고 ![]() 또는
또는 ![]() 버튼을 클릭하세요. 선택한 조회 범위 단위로 시간을 변경할 수 있습니다.
버튼을 클릭하세요. 선택한 조회 범위 단위로 시간을 변경할 수 있습니다.
Last Time Searched 옵션에는 최근에 검색한 시간 목록을 선택할 수 있습니다.
제공하는 메뉴 및 기능에 따라 선택할 수 있는 사전 정의된 조회 범위 목록은 다를 수 있습니다.
붙여넣기로 변경하기
시간 선택자에서 시간을 복사한 후 사용자가 원하는 시간으로 텍스트 값을 변경해 붙여넣기할 수 있습니다.
-
시간 선택자에서 년, 월, 일, 시간 영역에서
Ctrl + C키를 눌러 복사하세요. -
텍스트 편집기에 붙여 넣기한 후 원하는 날짜 및 시간으로 변경하세요.
-
텍스트 편집기에서 변경한 날짜 및 시간을 복사하세요.
-
시간 선택자에서
Ctrl + V키를 눌러 붙여 넣으세요.
-
붙여 넣기할 수 있는 날짜 및 시간 형식은 다음을 참조하세요.
YYYY/MM/DD HH:MM ~ YYYY/MM/DD HH:MM예, 2024/12/10 09:00 ~ 2024/12/11 13:00
-
날짜 및 시간 형식이 올바르지 않으면 붙여 넣기되지 않습니다.