Monitoring a Database Instance
This document has been created based on the Oracle Monitoring V2. For the Oracle monitoring V1 document, see the following.
Home > Select Project > Dashboard > Monitoring a Database Instance
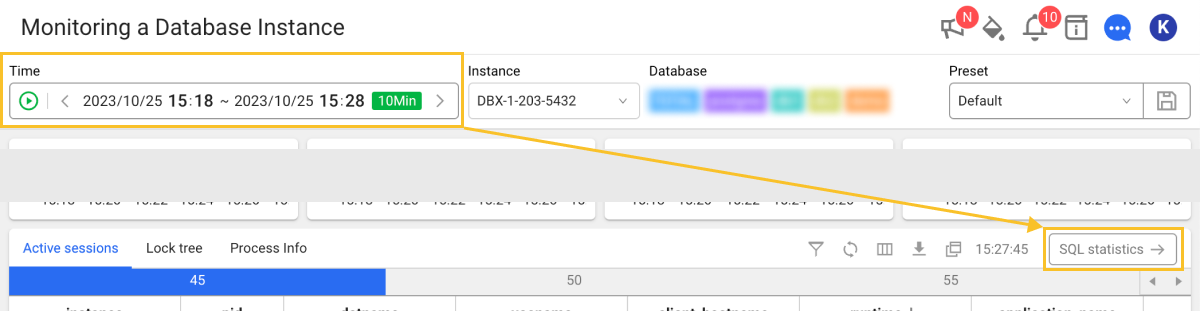
In Monitoring a Database Instance, you can monitor the key metrics of the database server, information details on active sessions, lock tree, PQ tree, and process information in real time. You can also see the alerts that could be problematic warnings. By default, the collected data for the last 10 minutes is retrieved in real time. Collected data is updated every 5 seconds.
Basic screen guide
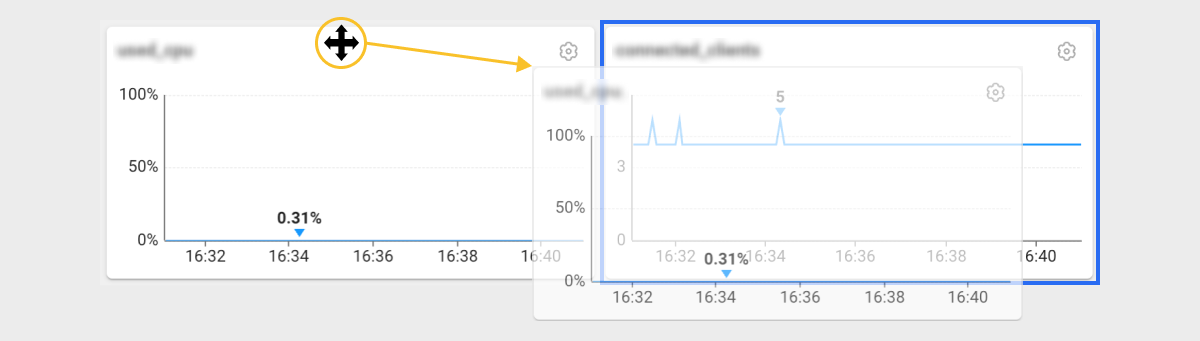
By default, the collected data for the last 10 minutes is retrieved in real time. If you select values in Time and Instance, the collected data is automatically applied to the To view the past data, click the green button in Time and then select the desired lookup time. You can search data up to the last 3 weeks. To query a random date and time, select the To search data from other agents, click Instance and then select a desired agent name. To change the position with another widget, select and drag the upper part of the widget. However, the size of the widget cannot be changed. When a specific time is selected in the widget, the real-time inquiry mode is stopped and the active sessions performed at the selected time zone appear in the The selected time can be seen on the upper right of the Active sessions table. In the Active sessions table list, the text colors are changed black → orange → Red, which means that the performance of the session is getting slower. You can search active sessions, lock trees, and processes information in real time. If you select a specific time of the chart in the widget, the real-time inquiry mode is stopped and the session performed at the selected time appears in the table. A time selection button appears above the table to search data in 5-second increments.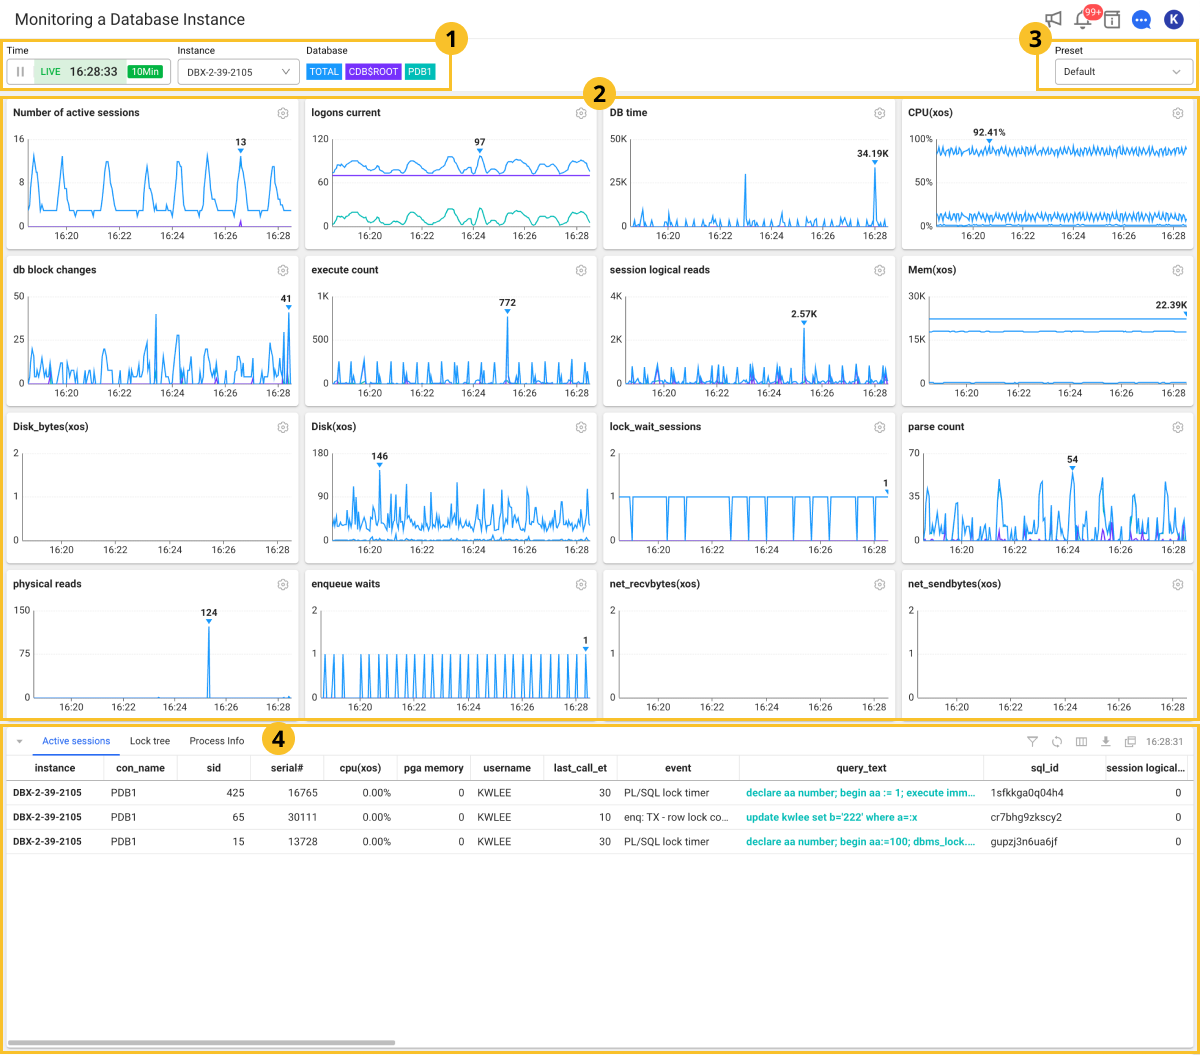
![]() Selecting the lookup time and target
Selecting the lookup time and target![]() graph chart and
graph chart and ![]() Active sessions table.
Active sessions table.
![]() button in Time. If you click the text range for date and time, the option appears to select the date and time. To search data in real time again, select
button in Time. If you click the text range for date and time, the option appears to select the date and time. To search data in real time again, select ![]() .
.![]() Graph chart section
Graph chart section![]() Default displays 16 metrics saved as presets as a graph chart widget. The horizontal axis of each widget is time, and the vertical axis is the metric number. To know the meaning of each metric, select
Default displays 16 metrics saved as presets as a graph chart widget. The horizontal axis of each widget is time, and the vertical axis is the metric number. To know the meaning of each metric, select ![]() next to the name or see the following.
next to the name or see the following.
![]() Active sessions table. After that, a button that allows you to view the data every 5 seconds appears on the Active sessions table.
Active sessions table. After that, a button that allows you to view the data every 5 seconds appears on the Active sessions table.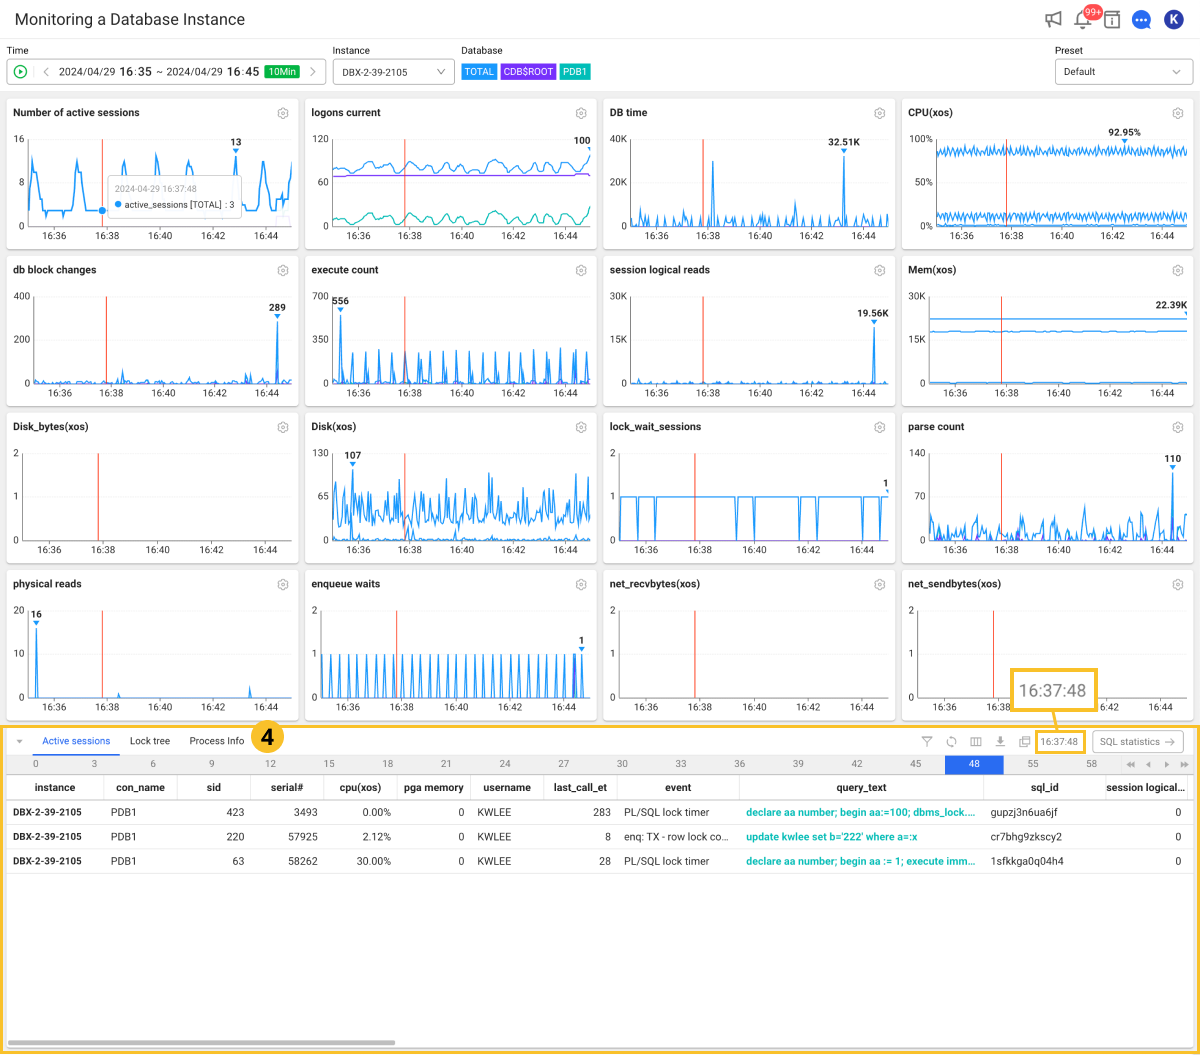
![]() Active Sessions / Lock Tree / Process Info
Active Sessions / Lock Tree / Process Info
-
Active sessions: You can view active sessions and queries.
-
If you select a session running, the Session detail window appears. You can see the details for the selected session. For more information, see the following.
-
If you select an item in the rightmost query_text column in the table, the SQL details window appears. You can see the full text and plan information for the selected query. For more information, see the following.
-
-
Lock tree
You can see the lock session information, and holder and waiter information in real time. For more information about the table columns, see the following.
-
Process Info
You can query the resource usage of the database server in real time.
By adding a linked project, you can view information details about active transactions associated with active sessions in the Active sessions table in real-time. For more detailed information about adding and using a linked project, see [the following] (linked-projects).
-
In the table list, the text colors are changed black → orange → Red, which means that the performance of the session is getting slower.
-
The Process Info can be checked only when the XOS agent has been installed. For more information, see the following.
Selecting metrics
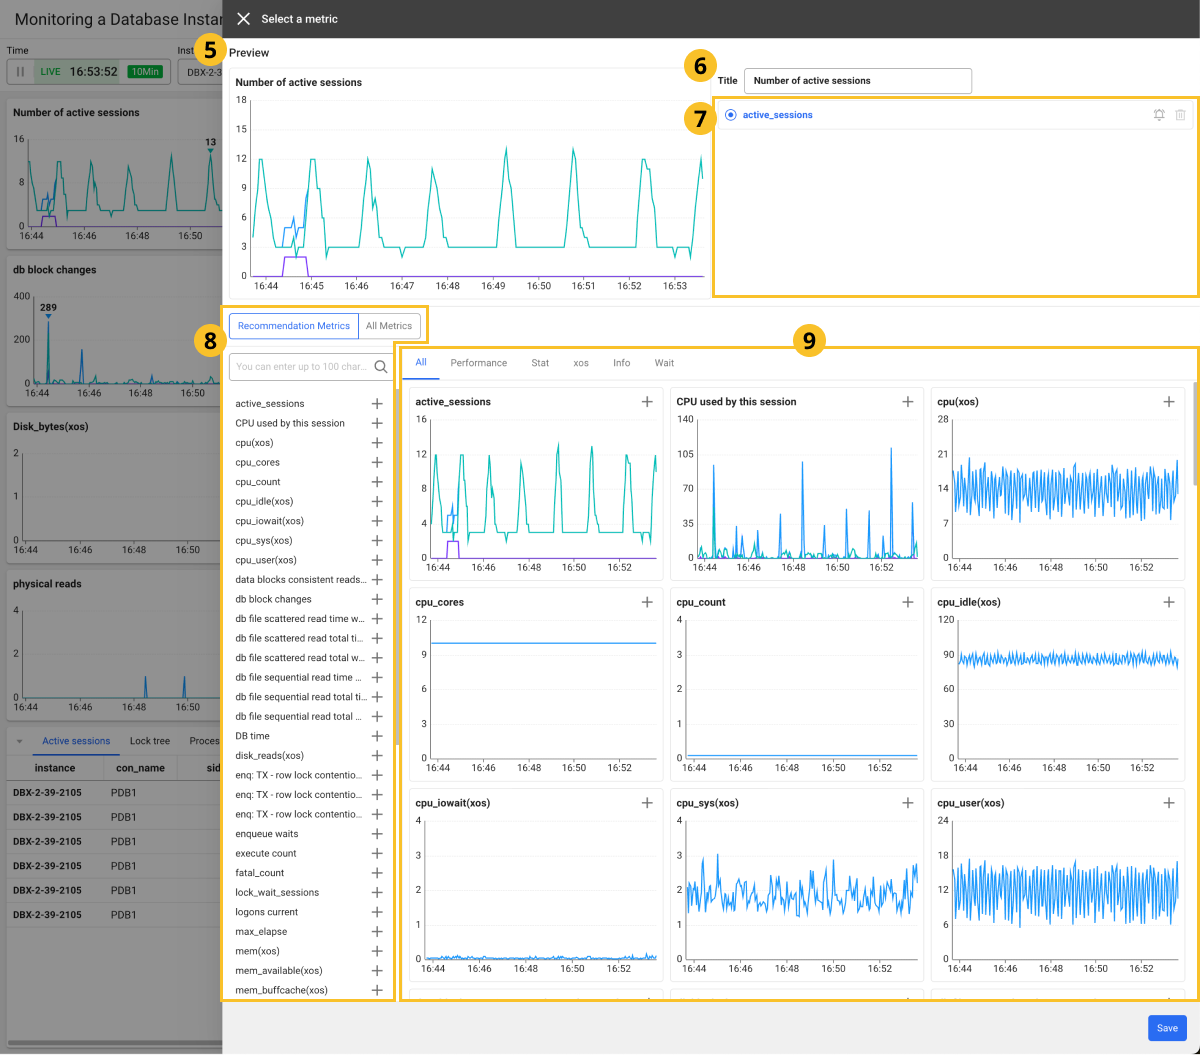
To add or replace the metric graph to the widget, select ![]() on the upper right of the widget. The Select a metric window appears. After completing the desired settings, select Save.
on the upper right of the widget. The Select a metric window appears. After completing the desired settings, select Save.
-
 Preview: You can preview the graph for the selected metric.
 -
 Title: Enter the widget name.
 -
 It displays the metrics displayed on the chart of the selected widget. You can select up to 4 metrics.Note
When you select
 on the right of a metric, the Event Configuration
 Newmenu appears, where you can configure the alerts based on the metric. -
 Recommendation Metrics / All Metrics: If you select Recommendation Metrics, the list of frequently viewed metrics in Database Monitoring appears. The metrics displayed in the list can be changed or added in the widget.
 -
In the
 area, you can see the trend of metrics in a graph and add or change any widget. By selecting a desired tab, you can narrow down the list of metrics according to the category.
Adding metrics
Multiple metrics can be added in a widget. You can add up to four metrics.
-
Select
 on the upper right of the widget to add the metrics in.
 -
If the Metric Select window appears, in the
metrics list or graph list, select  on the right of the metric to add.
 -
To add more metrics, repeat the step 2.
-
To easily identify the widget, change the
Title. -
Select Save on the lower right of the screen.
Charts are generated as many times added to the widget to which metrics are added. If you select ![]() next to the widget name, you can see the name and description of the added metric. You can also check the figure through a tooltip by hovering your mouse over the chart.
next to the widget name, you can see the name and description of the added metric. You can also check the figure through a tooltip by hovering your mouse over the chart.
The tooltip of the ![]() button is not supported in multiple languages.
button is not supported in multiple languages.
Changing a metric
You can change a metric in the widget to another.
-
Select
on the upper right of the widget to change the metrics. -
If the Metric Select window appears, select a metric to change in the
area. -
In the
metrics list or graph list, select a desired metric. -
In the
area, check that the name of the selected metric has been changed. -
Select Save on the lower right of the screen.
Deleting a metric
You can delete unnecessary metrics while multiple metrics have been set in the widget.
-
On the upper right of the widget to delete metrics from, select
. -
If the Metric Select window appears, select
 on the right of the metric to delete from the area.
 -
Select Save on the lower right of the screen.
At least one metric must be selected for a widget. You cannot delete all metrics in a widget.
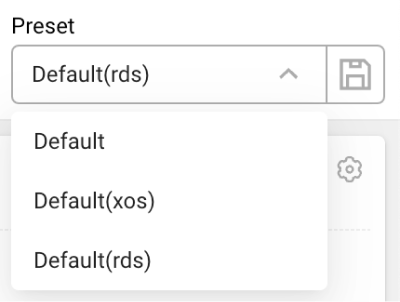
Preset
You can save and recall user-defined widget settings and active session table arrangements as presets. The following presets are provided by default, and the Default presets cannot be changed.
-
Default: It consists of major DB metrics.
-
Default(xos): It consists of key DB metrics and XOS metrics (CPU and memory utilization, memory SWAP usage, disk I/O, etc.).
-
Default(rds): It consists of key DB metrics and RDS CloudWatch metrics (CPU utilization, free memory space, free storage space, network, etc.).
Save Preset
-
Add or modify the widget metrics.
-
On the upper right of the screen, select
 .
. -
In Save preset, change the name and then select Save.
In the Preset list, select a saved item to fetch the settings.
-
The Default preset cannot be modified.
-
You can create custom presets up to 5. Including the modified metric graph, the column order, column width, and filter application content of the active sessions are also applied.
Deleting presets
If you select Preset on the upper right of the screen, the preset list appears. Select ![]() on the right of the preset to delete.
on the right of the preset to delete.
Using the active session section
Through Active sessions at the bottom of the screen, you can see the real-time active sessions. The following provides the guide for the button on the upper right of the table.
 : Using the column header entries in the table, the list can be filtered.
-
 : The list of tables is refreshed.
 -
 : The column header entries in the table can be displayed or hidden.
-
 : The active session can be stopped.Note
This feature is only available to the members with Edit role. For more information about member roles, see the following.
-
 : You can download the content of the table as a CSV file.
 -
 : A new window appears to see the list on a wider screen.
Checking the SQL statistics
You can see the list of top SQLs for the time period along with the trend of key performance metrics that occurred during the specific time in the past.
-
In Time, select
 to switch from real-time mode to non-real-time mode.
 -
In Time, set the time zone to view.
-
On the upper right of the Active sessions area, select SQL statistics.
SQL statistics appears in a new window. In Instance monitoring, you can see the top SQL list executed for the set time. For more information about SQL statistics, see the following.
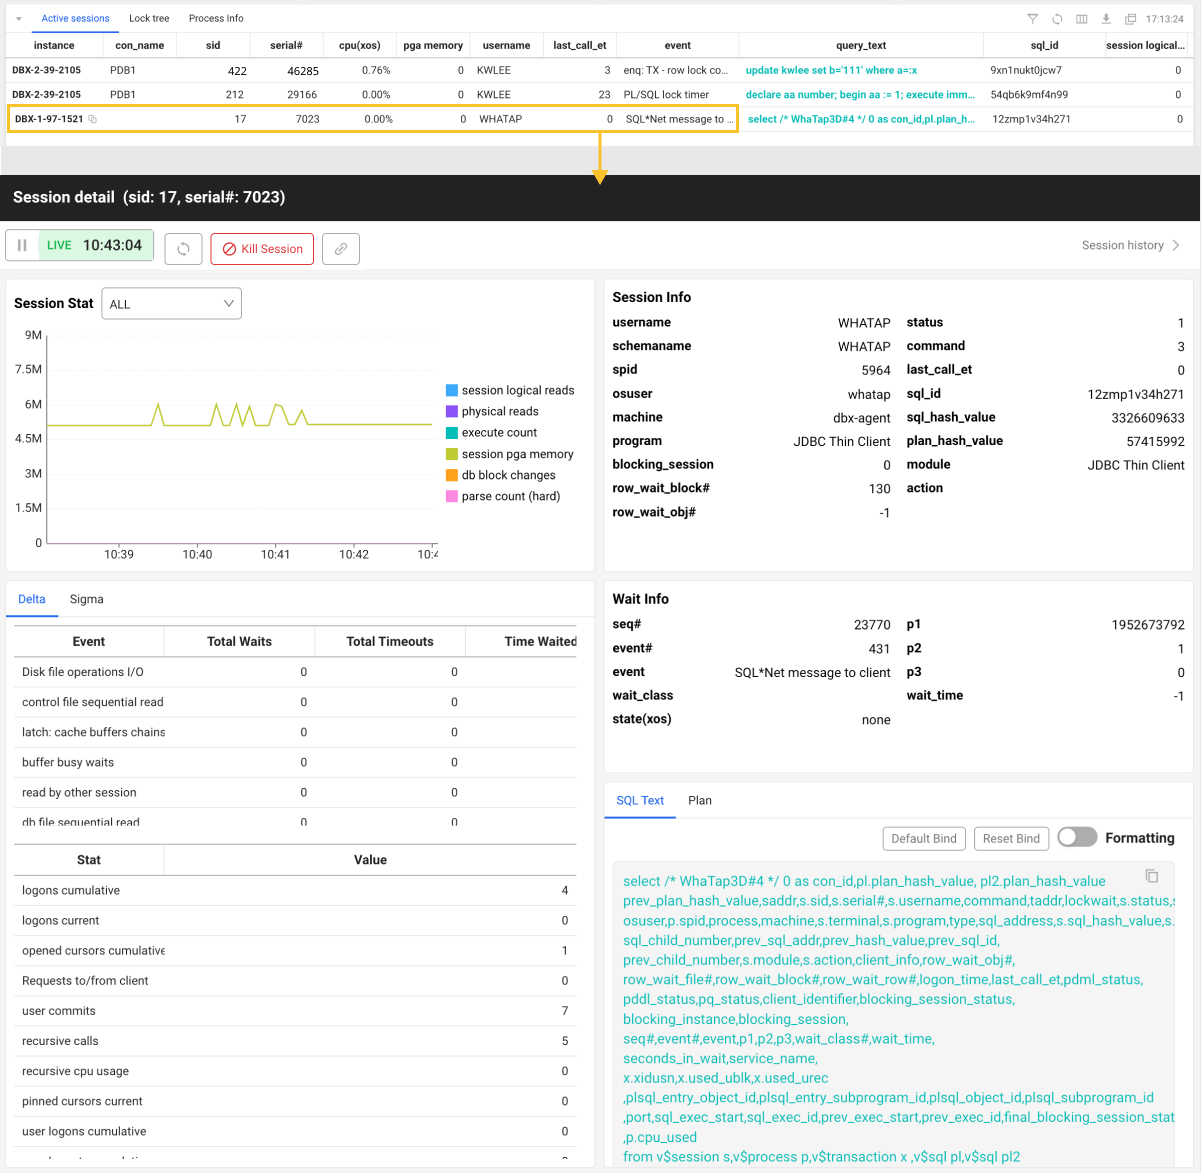
Checking the session information details
If you select a session in the Active sessions tab, the Session detail window appears. You can see the information details about the selected session.
-
The session information is viewed in real time by default. If you select
 in the time selector, you can stop a real-time view and see the data based on the paused time. To refresh data while pausing a real-time view, select .
 -
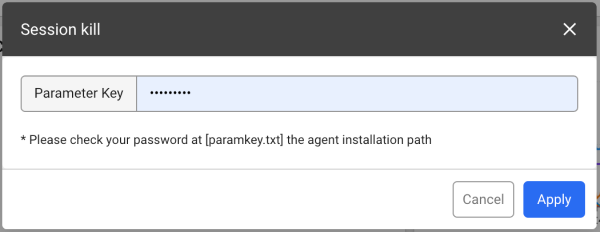
Kill Session: You can stop the selected session. If the Session kill window appears, enter the password (Parameter Key) and then select Apply.
NoteThis feature is only available in real-time viewing mode.
-
Session history: You can go to the Session History menu to see the records of the selected session.
NoteFor more information about Session History, see the following.
-
Session Stat: It provides various performance metrics and statistical information for the selected session. It includes the type and number of tasks performed in the session, resource usage, and more.
-
Delta / Sigma: The change rate and statistical analysis information for the selected session appear. You can check the amount of change in session activities.
- Session Info: You can see the basic information of the selected session and the information details including the status.
-
Wait Info: The waiting event and waiting time of the selected session are provided. You can also see information about the waiting events that occur when the database system is waiting to execute a specific task.
-
SQL Text / Plan: You can see the SQL query statements and plans of the selected session. For more information, see the following.
See query details
To check the SQL query information of the executing session, select the query (or sql_text) column in the Active sessions section. The SQL details window appears. You can check the SQL query statements and plan information.
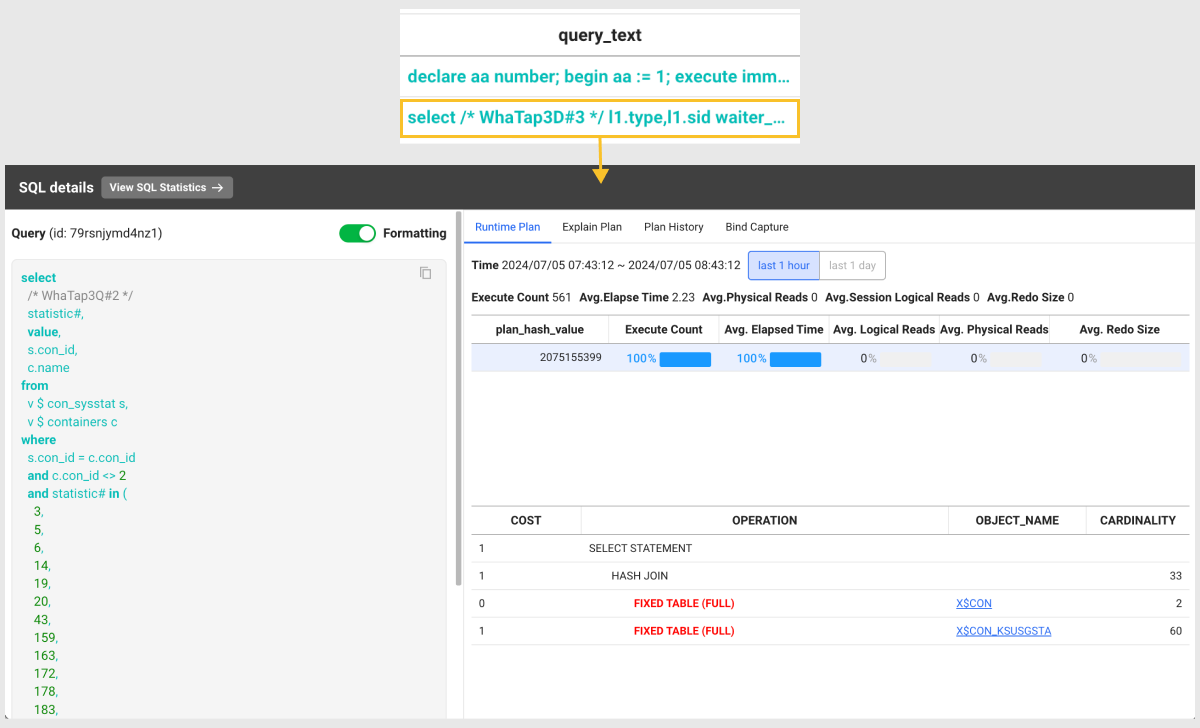
- View SQL Statistics: You can go to the SQL statistics menu where you can check statistical information related to the SQL query statement.
-
Runtime Plan: It provides the execution plan and runtime information for a selected SQL query. It provides the information details such as execution count, average execution time, and average physical reads.
-
Explain Plan: It displays the execution plan predicted by the optimizer. It provides information such as cost, job, object name, and cardinality.
-
Plan History: You can check the history of the execution plans of the SQL queries executed in the database.
-
Bind Capture: You can see the values of the bind variables used in SQL queries executed in the database. This allows you to see actual content of query executions.
NoteThis is a value captured in the database (
v$sql_bind_capture), not a bind value executed in real time. If the number of cases is too large, it displays up to 100.
Checking the linked projects
In Correlated Project Management, when another application project is added, the ![]() button is added to the active session entry.
button is added to the active session entry.
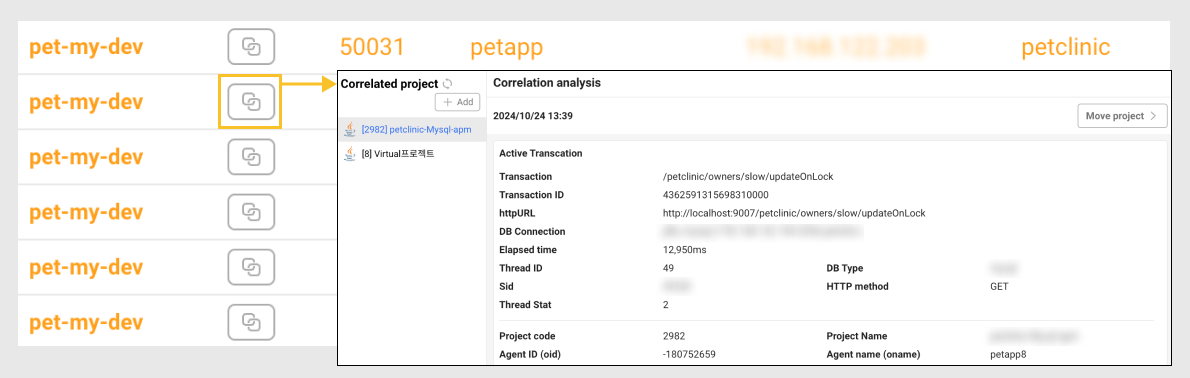
Through the Correlation analysis window that appears when the ![]() button is selected, you can check active transactions of the applications linked to active sessions. You can check specific metrics such as transaction ID, thread ID, client IP, and CPU usage time, along with basic information such as transaction URL and database connection information, DB type, HTTP method, and execution time. Additionally, you can monitor the SQL query execution time, number of SQL calls, DB connection time, and such, which allows you to comprehensively analyze the system performance.
button is selected, you can check active transactions of the applications linked to active sessions. You can check specific metrics such as transaction ID, thread ID, client IP, and CPU usage time, along with basic information such as transaction URL and database connection information, DB type, HTTP method, and execution time. Additionally, you can monitor the SQL query execution time, number of SQL calls, DB connection time, and such, which allows you to comprehensively analyze the system performance.
In particular, it provides the call stack information and SQL queries through stack traces, helping you trace and resolve detailed causes when problems occur. This allows you to perform in-depth analysis of interactions between applications and databases, and to quickly diagnose performance bottlenecks.
For more detailed information about adding and using a linked project, see [the following] (linked-projects).
Stopping an active session
-
Select
on the upper right of the table. -
Select the session to stop from the table list. You can select multiple items.
-
Select Stop.
-
If the Session kill window appears, enter the password (Parameter Key).
-
Select Apply.
The selected session is stopped.
-
Through the paramkey.txt file in the DBX agent installation path, you can find the password.
-
This function can be used by only the members with the Edit role. For more information about the member roles, see the following.
Zooming in the graph chart section

If the current screen is small and difficult to check the widgets, you can see the graph chart widget on a wider screen. Select ![]() at the bottom of the Active sessions section. The Active sessions section is collapsed and the graph chart widget section is expanded.
at the bottom of the Active sessions section. The Active sessions section is collapsed and the graph chart widget section is expanded.
To zoom out the graph chart widget, select ![]() at the bottom of the Active sessions section.
at the bottom of the Active sessions section.
Setting the table columns
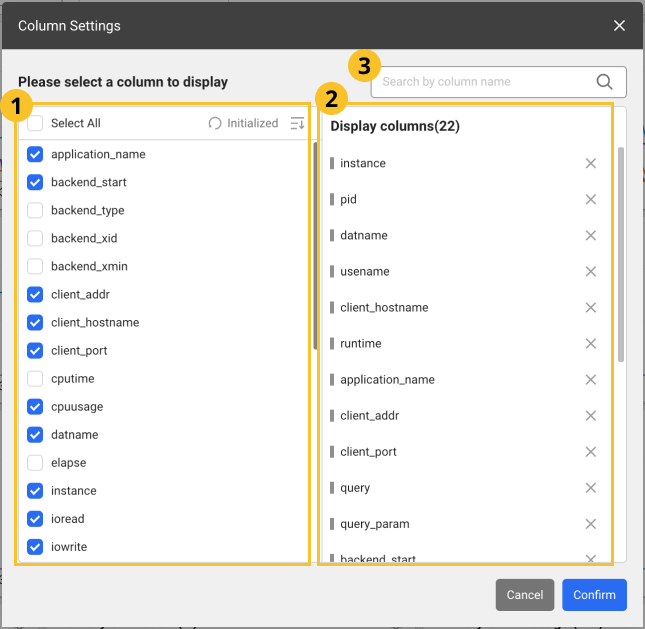
You can hide the table header columns or add any of them. You can also change the column order. Select ![]() .
.
-
After configuration, select Confirm to apply the settings in the table.
-
In the
 search bar, enter text to search the desired columns. Only the columns that meet the entered text are displayed.
 -
Images may differ depending on the product, project, or menu.
Adding columns
From the ![]() list, select the items to add as table header columns. To select all items, select Select All.
list, select the items to add as table header columns. To select all items, select Select All.
Deleting columns
From the ![]() list, unselect the columns to delete. Alternatively, select
list, unselect the columns to delete. Alternatively, select ![]() on the right of the item to delete from the
on the right of the item to delete from the ![]() list.
list.
Changing the column order
Drag an item to reposition from the ![]() list, and then move it to the desired position.
list, and then move it to the desired position.
Initializing the configuration
To cancel all changes and reset them, select ![]() Initialized.
Initialized.
Filtering the table data
-
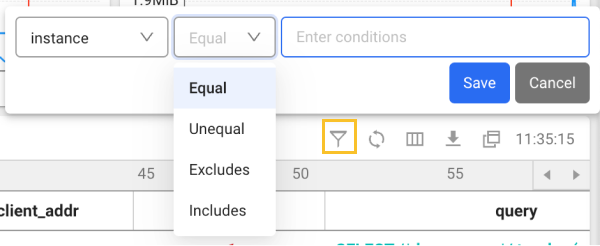
Select
on the upper right of the table. -
Select a column header and a condition in the table.
-
Enter a desired value in the Enter conditions field.
-
Select Save.
Column information guide
For more information about columns, see the link.
| Item | Description |
|---|---|
sid | Session ID |
cpu(xos) | CPU utilization collected by the installed XOS |
serial# | Value to increment to determine if the same session ID has been used. |
username | DB user name. |
command | Same as COMMAND_TYPE; SQL command number |
status | Session status |
schemaname | Schema. Same as the username. |
osuser | Username of the OS that accessed the session. |
spid | OS process ID. |
process | ID of the client process that accessed the session. |
logon_time | Session created time point. |
last_call_et | If the session is active, it is the elapsed time (sec) since activation. |
sql_text | query, running statement, SQL statement that separates literal strings |
sql_param | Literal value separated from query |
prev_sql_text | Previously executed query |
prev_sql_param | Previously executed query param |
program | Program information executed by client |
type | session type - can be adjusted in user background recursive (whatap.conf). |
seq# | Number that uniquely identifies the current or last wait (incremented with each wait) |
event | Number of the resource or event if the session is waiting. |
p1 | First waiting event parameter (decimal point) |
p2 | Second waiting event parameter (decimal point) |
p3 | Third waiting event parameter (decimal point) |
wait_class | Class name of the waiting event |
wait_time | The value is 0 if the session is waiting. It is the last waiting time (milliseconds) if the value is greater than 0. |
seconds_in_wait | Time spent waiting for the wait if the session is waiting. Otherwise, it is the time elapsed since the last waiting. |
state | Waiting state: WAITING, WAITED UNKNOWN TIME, WAITED SHORT TIME, WAITED KNOWN TIME |
machine | Name of the client server that accessed the session (hostname) |
port | Clinet port number |
terminal | Client terminal name |
module | Name of the module set by the user of the program executed on the client. |
action | Action name set by the user of the running module. |
client_info | Client information set by user |
client_identifier | Client ID set by user |
| session logical reads | Number of times data was read into the buffer cache |
| physical reads | Number of data reads from the physical disk |
| execute count | SQL execution count |
| parse count (hard) | Total number of syntax analysis calls (actual syntax analysis) |
| parse count (total) | Total number of syntax analysis calls (hard, soft, describe) |
| opened cursors current | Number of open cursors |
| db block changes | Change count of all blocks in the database |
| session pga memory | Session's current PGA size |
undo_segid | Undo information ID |
undo_blk | Undo block count |
undo_rec | Undo record count |
sql_address | SQL statement identification data |
sql_hash_value | SQL statement identification data |
sql_id | SQL ID of the running SQL statement |
sql_child_number | Sub number of the running SQL statement |
sql_exec_start | Start time point of SQL running in the session |
sql_exec_id | SQL running ID |
prev_sql_addr | Information that identifies the last run SQL statement |
prev_child_number | Sub number of the last SQL statement executed |
prev_exec_start | Start time point of the last SQL statement executed |
prev_exec_id | Start ID of the last SQL statement executed |
plsql_entry_object_id | Object ID of the top PL/SQL subprogram on the stack. |
plsql_entry_subprogram_id | ID of the top PL/SQL subprogram on the stack. |
plsql_object_id | Subprogram ID of the running PL/SQL object |
taddr | Transaction address |
lockwait | lock wait address (lock address where the session is waiting) |
row_wait_obj | Object ID of the table containing the row specified in ROW_WAIT_ROW# |
row_wait_file | ID of the data file containing the row specified in ROW_WAIT_ROW# |
row_wait_block | ID of the block containing the row specified in ROW_WAIT_ROW# |
row_wait_row | Currently locked row |
pdml_status | If the value is ENABLED, the session is in PARALLEL DML activation mode. If the value is DISABLED, the session does not support the PARALLEL DML activation mode. If the value is DISABLED, the session does not support the PARALLEL DML activation mode. |
pq_status | If the value is ENABLED, the session is in PARALLEL QUERY activation mode. If the value is DISABLE, the session does not support the PARALLEL QUERY activation mode. If the value is FORCED, it indicates the session was changed to force the use of PARALLEL QUERY. |
blocking_session_status | It provides details about whether there is a blocking session. |
blocking_instance | Instance ID for the blocking session |
blocking_session | Session ID for the blocking session |
final_blocking_session_status | It provides details about whether there is a last block session. |
final_blocking_instance | Instance ID for the last blocking session |
final_blocking_session | Session ID for the last blocking session |
service_name | Service name of the session. It is similar to the DB name. |
saddr | Session address |
con_id | ID of the container associated with the data (only for multi-database support) |
rss(xos) | OS metrics collected by the XOS agent |
pss(xos) | OS metrics collected by the XOS agent |
ioread(xos) | OS metrics collected by the XOS agent |
iowrite(xos) | OS metrics collected by the XOS agent |
WhaTap basically stores the client-related information.