Instance List
This document has been created based on the Oracle Monitoring V2. For the Oracle monitoring V1 document, see the following.
Home > Select Project > Dashboard > Instance List
You can see the list of database servers in which the agent has been installed. You can check key performance metrics and status for each instance. The performance metrics are updated every 5 seconds, and the order of the columns and the metrics in the list can be changed through settings.
Basic screen guide
-
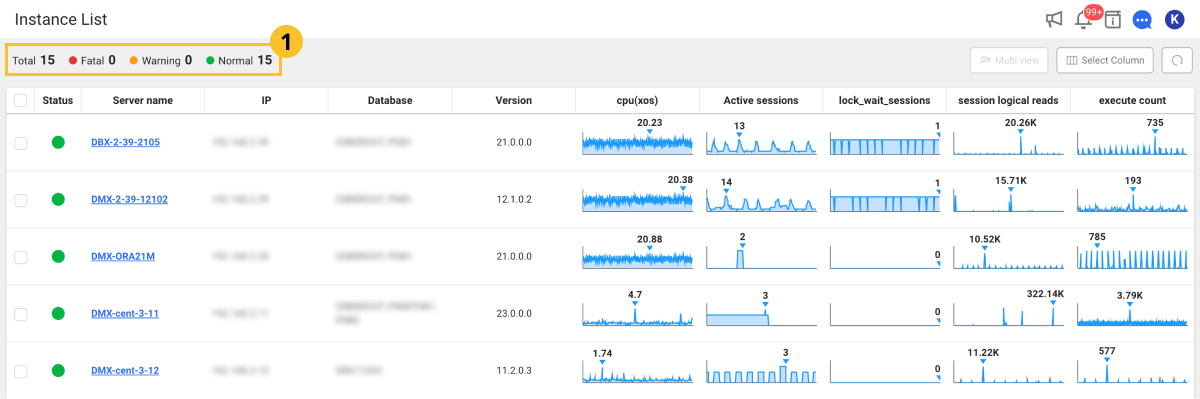
The
 area displays the status of instances set in the project. The displayed status data matches the total number of instances and matches the Status column data in the table.
 -
If you click an abnormal icon in the Status column, the Event window appears. You can see the history of events in the instance.
-
If you select each instance, Monitoring a Database Instance appears. You can monitor the detailed information about the selected instances in real time.
NoteFor more information about Monitoring a Database Instance, see the following.
-
It provides the key performance metrics in graph charts. The highest number appears on the chart. Hover your mouse over the chart to see the number at that location. For more information about the performance metrics, see the following.
-
You can see real-time alerts by selecting
 at the upper right of the screen. For more information about the alert settings, see the following.Note
For more information about the fixed area on the top of the screen, see the following.
Comparing the instance metrics
You can select multiple instances to compare the performance metrics. If you select an instance to compare the performance metrics from the list, the Multi view button becomes active on the upper right of the screen. If you select Multi view, the Monitoring Multiple Instances menu appears. You can see the graph charts for comparing data for key performance metrics and the detailed information about active sessions and lock trees.
For more information about Monitoring Multiple Instances, see the following.
Displaying or hiding columns
You can display or hide the performance metrics columns in the instance list. Select Select Column on the upper right of the screen. Check or uncheck the desired items. You can display or hide the columns.