Cloud Settings
Home > Select Project > Management > Cloud Settings
It provides the feature to set up additional collection and monitoring for monitoring metrics provided by cloud services on the dashboard of the database project. Through the Cloud Settings menu, you can monitor the resource status of the cloud database server in real time to maximize the operational efficiency.
-
The configuration process is intuitive and easy, so even non-developers can quickly perform it.
-
After completing the configuration, you can immediately check and correct errors through visual feedbacks.
-
By creating and configuring roles directly on the CSP console, you can enable granular control over security groups and policies.
After configuration, extra charge may be incurred in the cloud depending on the usage, separate from the WhaTap fee. Check the pricing policy of the cloud service in use before installation.
AWS CloudWatch configuration
You can monitor the status and resource usage of the database running in the AWS cloud environment.
Selecting the service to which you want to add metrics

In the first section, select AWS CloudWatch. Install the AWS CloudFormation template to collect the Amazon CloudWatch metric.
Entering parameters
Enter required items before proceeding with the AWS Cloud Formation configuration.

-
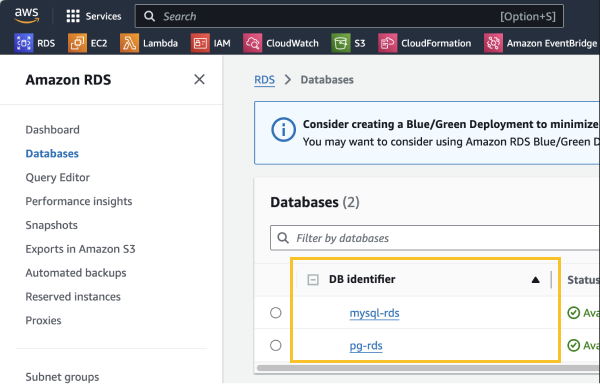
DB Identifier: Enter the identifier of the AWS database instance to monitor.
NoteEnter the DB identifier value of the Database instance created by the Amazon RDS service.

-
Instance: Select an instance (agent) to monitor metrics collected from databases running in the AWS cloud environment.
-
Interval: Select a metric collection interval. (60 sec / 300 sec)
Configuring the AWS CloudFormation
Install the AWS CloudFormation template provided by WhaTap. This template allows you to collect the CloudWatch metric through WhaTap. If you select AWS CloudFormation Setting, the installation starts and the configuration process is performed.

-
When you select AWS CloudFormation Setting, the AWS CloudFormation configuration screen appears.
-
Check the values for the items automatically filled in the Stack name and Parameters sections.
-
Select Create stack located at the bottom of the screen.
-
For more information about AWS CloudFormation, see the following link.
-
For the Amazon CloudWatch metrics about Amazon RDS, see the following link.
Setting the required roles
To create a CloudFormation stack, set the following AWS roles:Guide to AWS roles (JSON)
{
  "Version": "2012-10-17",
  "Statement": [
    {
      "Effect": "Allow",
      "Action": [
        "cloudformation:CreateStack",
        "cloudformation:UpdateStack",
        "cloudformation:DeleteStack",
        "cloudformation:DescribeStacks",
        "cloudformation:DescribeStackResources",
        "cloudformation:GetTemplateSummary",
        "cloudformation:DescribeStackEvents",
        "cloudformation:ListStacks",
        "cloudformation:ListStackResources"
      ],
      "Resource": "*"
    },
    {
      "Effect": "Allow",
      "Action": [
        "lambda:CreateFunction",
        "lambda:UpdateFunctionCode",
        "lambda:UpdateFunctionConfiguration",
        "lambda:InvokeFunction",
        "lambda:DeleteFunction",
        "lambda:GetFunction",
        "lambda:GetFunctionConfiguration",
        "lambda:ListFunctions"
      ],
      "Resource": "*"
    },
    {
      "Effect": "Allow",
      "Action": [
        "logs:CreateLogGroup",
        "logs:CreateLogStream",
        "logs:PutLogEvents"
      ],
      "Resource": "*"
    },
    {
      "Effect": "Allow",
      "Action": [
        "events:PutRule",
        "events:PutTargets",
        "events:RemoveTargets",
        "events:DeleteRule",
        "events:DescribeRule",
        "events:EnableRule",
        "events:DisableRule"
      ],
      "Resource": "*"
    },
    {
      "Effect": "Allow",
      "Action": [
        "iam:CreateRole",
        "iam:AttachRolePolicy",
        "iam:PutRolePolicy",
        "iam:GetRole",
        "iam:DeleteRole",
        "iam:PassRole",
        "iam:ListRoles"
      ],
      "Resource": "*"
    },
    {
      "Effect": "Allow",
      "Action": [
        "cloudwatch:GetMetricData"
      ],
      "Resource": "*"
    },
    {
      "Effect": "Allow",
      "Action": [
        "s3:GetObject"
      ],
      "Resource": "arn:aws:s3:::repo.whatap.io/agent/db/WhaTapRDSMonitoring.zip"
    },
    {
      "Effect": "Allow",
      "Action": [
        "scheduler:GetSchedule",
        "scheduler:ListSchedules",
        "scheduler:CreateSchedule"
      ],
      "Resource": "*"
    }
  ]
}
-
Copy the JSON content from Guide to AWS roles.
-
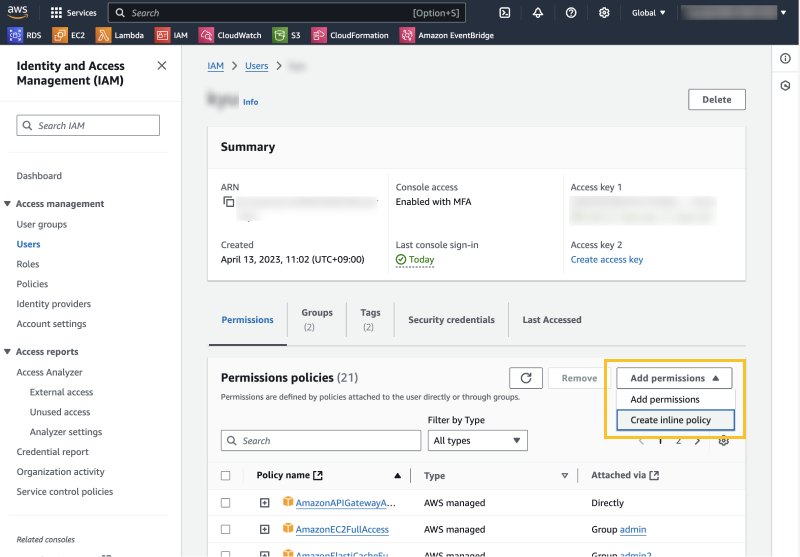
In IAM, select a user that will create the CloudFormation stack.
-
Select Create inline policy.

-
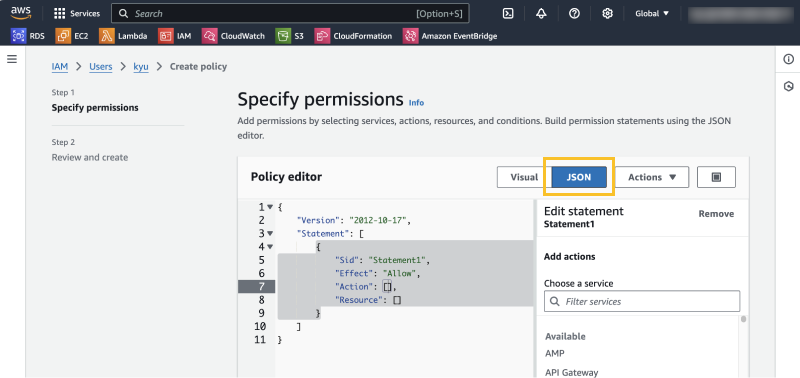
After selecting JSON, paste the copied roles to register the policy.

Checking the collection metrics
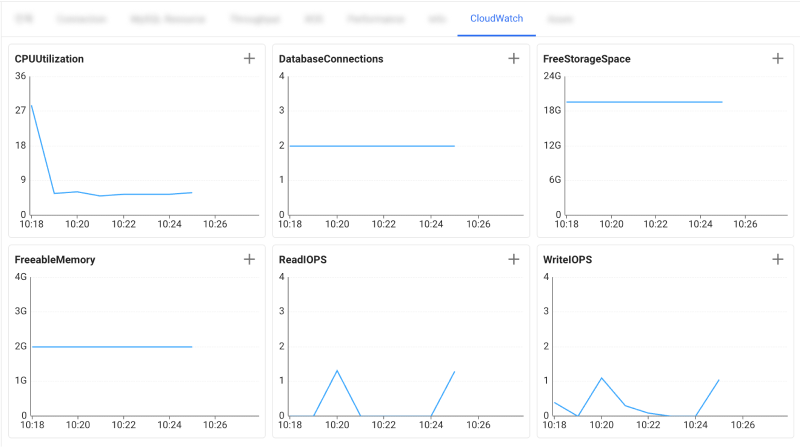
After completing the cloud data connection, the Added cloud services section is generated on the screen. You can see a list of instances (agents) connected to the cloud database and the metrics being collected.

The metrics collected from AWS CloudWatch fall into the CloudWatch category.

You can check in the following paths.
-
Dashboard > Monitoring a Database Instance: You can select metrics by selecting the
button on the widget.
-
Dashboard > Monitoring Multiple Instances: You can select metrics by adding custom widgets.
-
For more information on how to change the metrics of a widget in the Monitoring a Database Instance menu, see the following.
-
For more information on how to add custom widgets in the Monitoring Multiple Instances menu, see the following.
-
In Analysis > Metrics Search, select the Category entry with db_aws_rds. You can check the related tags and fields.