Lock tree
This document has been created based on the Oracle Monitoring V2. For the Oracle monitoring V1 document, see the following.
Home > Select Project > Analysis > Lock Tree
This tool analyzes the trend of locks that occurred during the day. This function allows you to visually check the tree structure of the session that generated the lock (lock holder) and the session waiting for the lock (lock waiter). You can analyze the relationship between the holder and waiter of the lock that occurred at a specific time point.
Key features are as follows:
-
Lock trend analysis: The trends of locks that occurred during the set search period are traced over time and displayed in a graph. This allows you to visually check how the locks are created and resolved.
-
Check lock holder and waiter: You can see the holder and waiter for each lock in a tree structure. Through this, when a specific lock occurs, you can check the relationship between the session that generated the lock and the waiting session.
-
Inter-session relationship analysis: By analyzing the relationship between the session that generated the lock and the waiting session, you can identify the cause of the lock that occurred during the query execution and transaction handling.
This allows the database administrator to quickly identify and resolve lock-related issues and optimize the database performance.
Basic usage guide
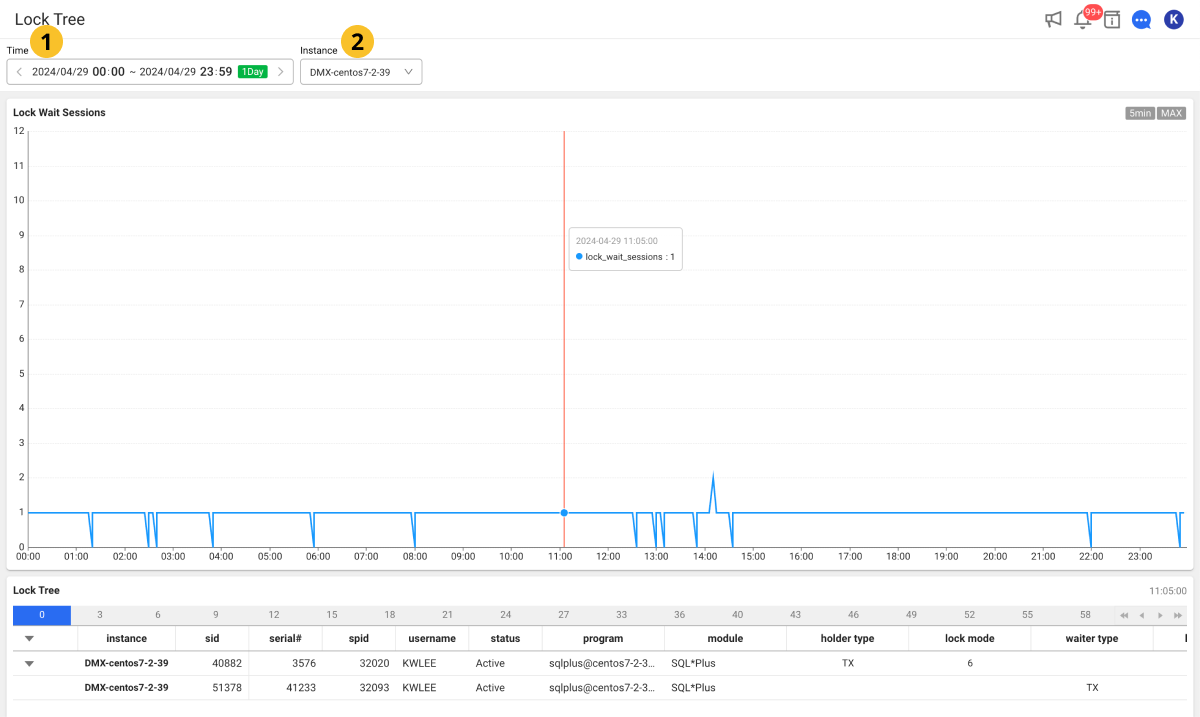
Set the desired ![]() date and time, and then select an instance from the
date and time, and then select an instance from the ![]() list. If a lock occurs at the set time, lock wait sessions and the retrieved data appear in the table at the bottom of the screen.
list. If a lock occurs at the set time, lock wait sessions and the retrieved data appear in the table at the bottom of the screen.
For more information on how to use the Time option, see the following.
Column information guide
For more information about columns, see the link.
| Item | Description |
|---|---|
sid | Session ID |
cpu(xos) | CPU utilization collected by the installed XOS |
serial# | Value to increment to determine if the same session ID has been used. |
username | DB user name. |
command | Same as COMMAND_TYPE; SQL command number |
status | Session status |
schemaname | Schema. Same as the username. |
osuser | Username of the OS that accessed the session. |
spid | OS process ID. |
process | ID of the client process that accessed the session. |
logon_time | Session created time point. |
last_call_et | If the session is active, it is the elapsed time (sec) since activation. |
sql_text | query, running statement, SQL statement that separates literal strings |
sql_param | Literal value separated from query |
prev_sql_text | Previously executed query |
prev_sql_param | Previously executed query param |
program | Program information executed by client |
type | session type - can be adjusted in user background recursive (whatap.conf). |
seq# | Number that uniquely identifies the current or last wait (incremented with each wait) |
event | Number of the resource or event if the session is waiting. |
p1 | First waiting event parameter (decimal point) |
p2 | Second waiting event parameter (decimal point) |
p3 | Third waiting event parameter (decimal point) |
wait_class | Class name of the waiting event |
wait_time | The value is 0 if the session is waiting. It is the last waiting time (milliseconds) if the value is greater than 0. |
seconds_in_wait | Time spent waiting for the wait if the session is waiting. Otherwise, it is the time elapsed since the last waiting. |
state | Waiting state: WAITING, WAITED UNKNOWN TIME, WAITED SHORT TIME, WAITED KNOWN TIME |
machine | Name of the client server that accessed the session (hostname) |
port | Clinet port number |
terminal | Client terminal name |
module | Name of the module set by the user of the program executed on the client. |
action | Action name set by the user of the running module. |
client_info | Client information set by user |
client_identifier | Client ID set by user |
| session logical reads | Number of times data was read into the buffer cache |
| physical reads | Number of data reads from the physical disk |
| execute count | SQL execution count |
| parse count (hard) | Total number of syntax analysis calls (actual syntax analysis) |
| parse count (total) | Total number of syntax analysis calls (hard, soft, describe) |
| opened cursors current | Number of open cursors |
| db block changes | Change count of all blocks in the database |
| session pga memory | Session's current PGA size |
undo_segid | Undo information ID |
undo_blk | Undo block count |
undo_rec | Undo record count |
sql_address | SQL statement identification data |
sql_hash_value | SQL statement identification data |
sql_id | SQL ID of the running SQL statement |
sql_child_number | Sub number of the running SQL statement |
sql_exec_start | Start time point of SQL running in the session |
sql_exec_id | SQL running ID |
prev_sql_addr | Information that identifies the last run SQL statement |
prev_child_number | Sub number of the last SQL statement executed |
prev_exec_start | Start time point of the last SQL statement executed |
prev_exec_id | Start ID of the last SQL statement executed |
plsql_entry_object_id | Object ID of the top PL/SQL subprogram on the stack. |
plsql_entry_subprogram_id | ID of the top PL/SQL subprogram on the stack. |
plsql_object_id | Subprogram ID of the running PL/SQL object |
taddr | Transaction address |
lockwait | lock wait address (lock address where the session is waiting) |
row_wait_obj | Object ID of the table containing the row specified in ROW_WAIT_ROW# |
row_wait_file | ID of the data file containing the row specified in ROW_WAIT_ROW# |
row_wait_block | ID of the block containing the row specified in ROW_WAIT_ROW# |
row_wait_row | Currently locked row |
pdml_status | If the value is ENABLED, the session is in PARALLEL DML activation mode. If the value is DISABLED, the session does not support the PARALLEL DML activation mode. If the value is DISABLED, the session does not support the PARALLEL DML activation mode. |
pq_status | If the value is ENABLED, the session is in PARALLEL QUERY activation mode. If the value is DISABLE, the session does not support the PARALLEL QUERY activation mode. If the value is FORCED, it indicates the session was changed to force the use of PARALLEL QUERY. |
blocking_session_status | It provides details about whether there is a blocking session. |
blocking_instance | Instance ID for the blocking session |
blocking_session | Session ID for the blocking session |
final_blocking_session_status | It provides details about whether there is a last block session. |
final_blocking_instance | Instance ID for the last blocking session |
final_blocking_session | Session ID for the last blocking session |
service_name | Service name of the session. It is similar to the DB name. |
saddr | Session address |
con_id | ID of the container associated with the data (only for multi-database support) |
rss(xos) | OS metrics collected by the XOS agent |
pss(xos) | OS metrics collected by the XOS agent |
ioread(xos) | OS metrics collected by the XOS agent |
iowrite(xos) | OS metrics collected by the XOS agent |
WhaTap basically stores the client-related information.