Comparison between count trends
This document has been created based on the Oracle Monitoring V2. For the Oracle monitoring V1 document, see the following.
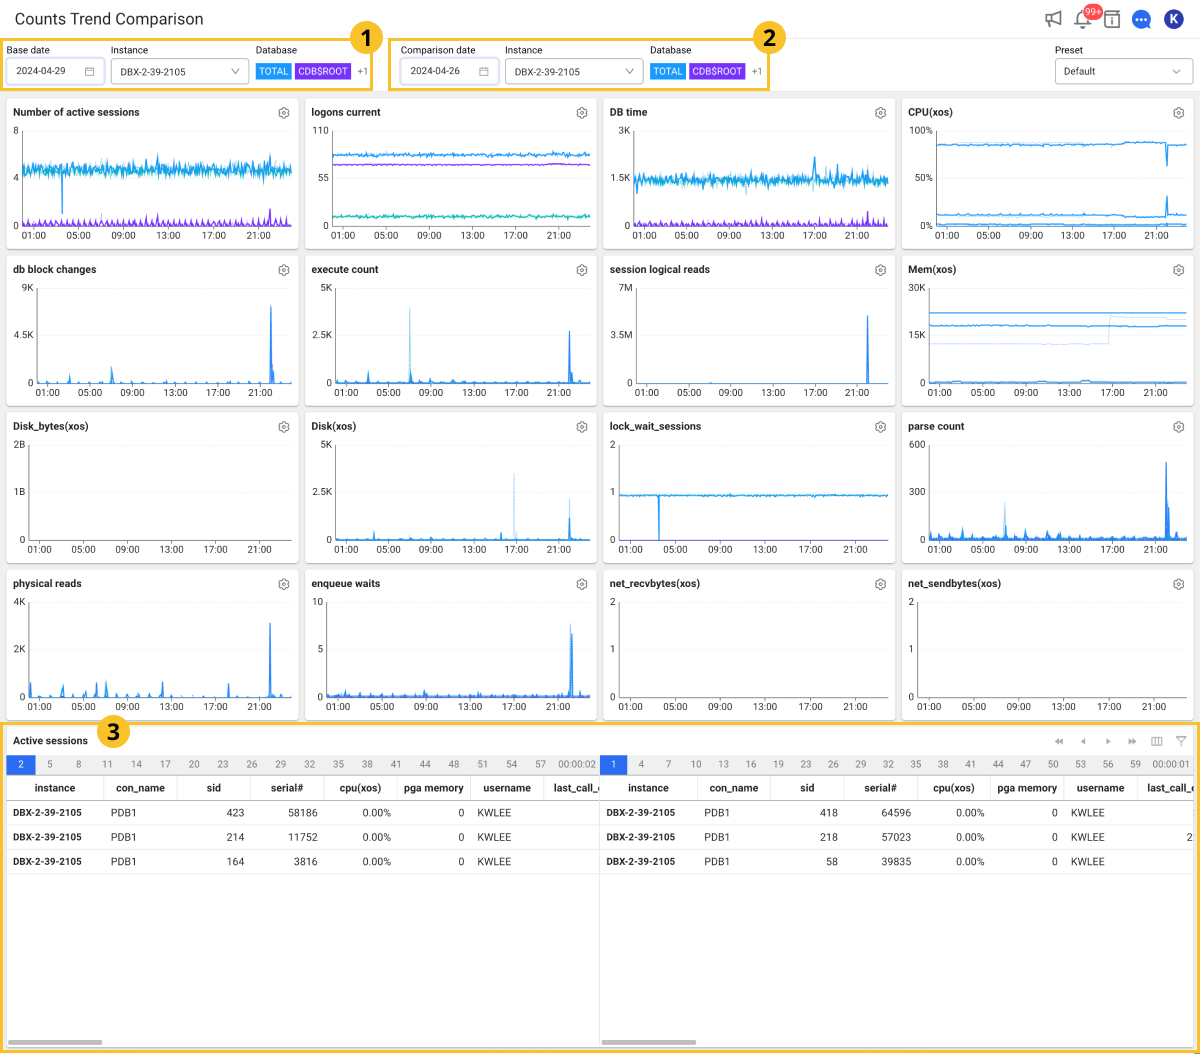
Home > Select Project > Analysis > Counts Trend Comparison
You can check the operation trend of the key metrics of the database over time and trace the performance. You can also check the database operation trend by comparing the count trends on different dates. Through the Active sessions table, you can check active sessions and identify long-running sessions.
Basic screen guide
-
If you select
 Base date,
  Comparison date, and Instance, the data is automatically applied to all widgets based on the selected items.
 -
To see the meaning of the metric displayed in the widget, select
 next to the name or see the following.Note
The tooltip of the
button is not supported in multiple languages. -
To change the position with another widget, select and drag the upper part of the widget. However, the size of the widget cannot be changed.
-
The left of the
 Active sessions table displays the data for the Base date, and the right of the table displays the data for the Comparison date.
 -
In the
Active sessions table, the text colors are changed black → orange → Red, which means that the performance of the session is getting slower.
Selecting a comparison target
Select ![]() Base date and Instance, and then select
Base date and Instance, and then select ![]() Comparison date and Instance. You can check the data details at the time point through a tooltip that appears by hovering the mouse over the chart. The content of the tooltip is updated based on the position of the mouse.
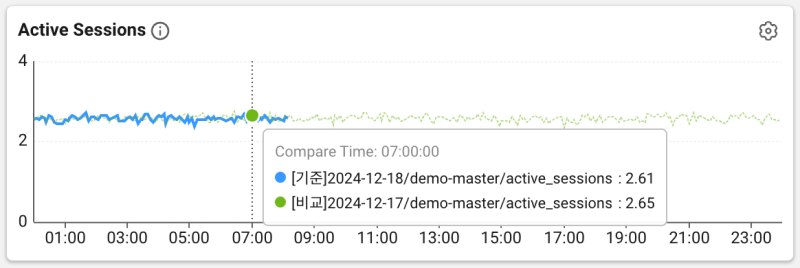
Comparison date and Instance. You can check the data details at the time point through a tooltip that appears by hovering the mouse over the chart. The content of the tooltip is updated based on the position of the mouse.
-
Each series is given a unique color for easy visual distinction. The solid line represents the data in Base date, and the dotted line represents the data in Comparison date.
-
Compare Time displays the time value of the data where the mouse pointer is located.
-
It displays the metric value at the time point of the selected data, and provides the data by series. Each series includes the metric name, date, and value of the data point.
-
In Database, you can select a database for comparison.
-
The colors in Database are the same in the graph chart.
Comparing the active session data
-
The time zone for data retrieval can be checked in
 .
. -
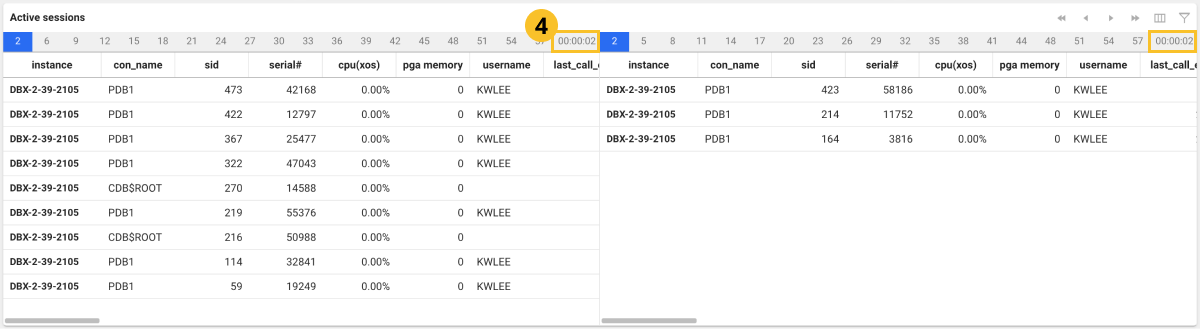
Active session data is collected every 5 seconds. You can search data for the desired time by selecting the button that moves in 5-second increments on the table.
-
If you select
 or
or  on the upper right, you can see the data in 1-minute increments. To move in increments of 5 seconds, select
  or
or  .
. -
In the Active sessions table list, the text colors are changed black → orange → Red, which means that the performance of the session is getting slower.
-
If you click a specific time point of the graph chart, the (
) area appears with a red line and the collected active sessions can be also seen.
Comparing with a specific time
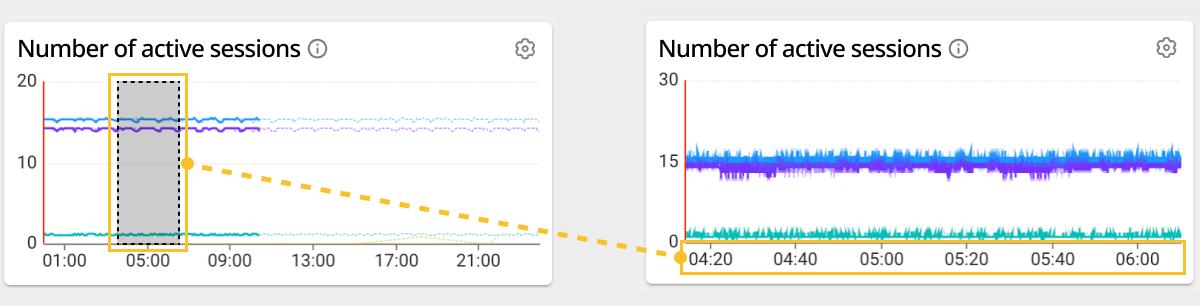
You can compare the data by zooming in on a specific time point. Select a desired time zone to anywhere on the widgets and then drag the chart. It displays the data for a specific time zone dragged to all widgets and active session tables.
Preset
In Monitoring a Database Instance, you can load the custom widget settings and the sorted active sessions as presets.
For more information about the Preset configuration, see the following.
Column information guide
For more information about columns, see the link.
| Item | Description |
|---|---|
sid | Session ID |
cpu(xos) | CPU utilization collected by the installed XOS |
serial# | Value to increment to determine if the same session ID has been used. |
username | DB user name. |
command | Same as COMMAND_TYPE; SQL command number |
status | Session status |
schemaname | Schema. Same as the username. |
osuser | Username of the OS that accessed the session. |
spid | OS process ID. |
process | ID of the client process that accessed the session. |
logon_time | Session created time point. |
last_call_et | If the session is active, it is the elapsed time (sec) since activation. |
sql_text | query, running statement, SQL statement that separates literal strings |
sql_param | Literal value separated from query |
prev_sql_text | Previously executed query |
prev_sql_param | Previously executed query param |
program | Program information executed by client |
type | session type - can be adjusted in user background recursive (whatap.conf). |
seq# | Number that uniquely identifies the current or last wait (incremented with each wait) |
event | Number of the resource or event if the session is waiting. |
p1 | First waiting event parameter (decimal point) |
p2 | Second waiting event parameter (decimal point) |
p3 | Third waiting event parameter (decimal point) |
wait_class | Class name of the waiting event |
wait_time | The value is 0 if the session is waiting. It is the last waiting time (milliseconds) if the value is greater than 0. |
seconds_in_wait | Time spent waiting for the wait if the session is waiting. Otherwise, it is the time elapsed since the last waiting. |
state | Waiting state: WAITING, WAITED UNKNOWN TIME, WAITED SHORT TIME, WAITED KNOWN TIME |
machine | Name of the client server that accessed the session (hostname) |
port | Clinet port number |
terminal | Client terminal name |
module | Name of the module set by the user of the program executed on the client. |
action | Action name set by the user of the running module. |
client_info | Client information set by user |
client_identifier | Client ID set by user |
| session logical reads | Number of times data was read into the buffer cache |
| physical reads | Number of data reads from the physical disk |
| execute count | SQL execution count |
| parse count (hard) | Total number of syntax analysis calls (actual syntax analysis) |
| parse count (total) | Total number of syntax analysis calls (hard, soft, describe) |
| opened cursors current | Number of open cursors |
| db block changes | Change count of all blocks in the database |
| session pga memory | Session's current PGA size |
undo_segid | Undo information ID |
undo_blk | Undo block count |
undo_rec | Undo record count |
sql_address | SQL statement identification data |
sql_hash_value | SQL statement identification data |
sql_id | SQL ID of the running SQL statement |
sql_child_number | Sub number of the running SQL statement |
sql_exec_start | Start time point of SQL running in the session |
sql_exec_id | SQL running ID |
prev_sql_addr | Information that identifies the last run SQL statement |
prev_child_number | Sub number of the last SQL statement executed |
prev_exec_start | Start time point of the last SQL statement executed |
prev_exec_id | Start ID of the last SQL statement executed |
plsql_entry_object_id | Object ID of the top PL/SQL subprogram on the stack. |
plsql_entry_subprogram_id | ID of the top PL/SQL subprogram on the stack. |
plsql_object_id | Subprogram ID of the running PL/SQL object |
taddr | Transaction address |
lockwait | lock wait address (lock address where the session is waiting) |
row_wait_obj | Object ID of the table containing the row specified in ROW_WAIT_ROW# |
row_wait_file | ID of the data file containing the row specified in ROW_WAIT_ROW# |
row_wait_block | ID of the block containing the row specified in ROW_WAIT_ROW# |
row_wait_row | Currently locked row |
pdml_status | If the value is ENABLED, the session is in PARALLEL DML activation mode. If the value is DISABLED, the session does not support the PARALLEL DML activation mode. If the value is DISABLED, the session does not support the PARALLEL DML activation mode. |
pq_status | If the value is ENABLED, the session is in PARALLEL QUERY activation mode. If the value is DISABLE, the session does not support the PARALLEL QUERY activation mode. If the value is FORCED, it indicates the session was changed to force the use of PARALLEL QUERY. |
blocking_session_status | It provides details about whether there is a blocking session. |
blocking_instance | Instance ID for the blocking session |
blocking_session | Session ID for the blocking session |
final_blocking_session_status | It provides details about whether there is a last block session. |
final_blocking_instance | Instance ID for the last blocking session |
final_blocking_session | Session ID for the last blocking session |
service_name | Service name of the session. It is similar to the DB name. |
saddr | Session address |
con_id | ID of the container associated with the data (only for multi-database support) |
rss(xos) | OS metrics collected by the XOS agent |
pss(xos) | OS metrics collected by the XOS agent |
ioread(xos) | OS metrics collected by the XOS agent |
iowrite(xos) | OS metrics collected by the XOS agent |
WhaTap basically stores the client-related information.