Top SQL Comparison
This document has been created based on the Oracle Monitoring V2. For the Oracle monitoring V1 document, see the following.
Home > Select Project > Analysis > Top SQL Comparison
You can compare the SQL trends in the time zone set based on a specific date. You can compare the performance of SQL by selecting multiple criteria and view it as a time series graph via Summary Chart. Additionally, the table list at the bottom of the screen allows you to compare the Top SQL rankings and fluctuations between the reference date and the comparison date.

-
Check SQL performance: You can easily check the SQL performance through the Top SQL Comparison menu. You can quickly identify performance issues in your system by comparing the number of SQL executions, maximum elapsed time, total elapsed time, waiting time, and more.
-
Check trends over time: You can visually check the performance changes of SQL over time through Summary Chart. This allows users to quickly identify and respond to time zones or sections of system load or performance degradation.
-
Top SQL comparison: The table list at the bottom of the screen allows you to compare the Top SQL rankings for the reference date and the comparison date. This allows users to see and compare performance changes in SQL and take necessary actions to improve the performance.
Comparing Top SQLs
Set the conditions for Top SQL comparison on the screen and then select .
-
Reference time: Set the reference time for comparison. It can be set up to 24 hours. By clicking the green button, the options to select a viewing time appear. Select the date and time area to set your own preferred time.
Note-
The maximum time range that can be viewed is 24 hours.
-
For more information on how to use the Reference time option, see the following.
-
-
Comparison: Select a date or time to compare with the time set in Reference time. Select the desired conditions and then select Confirm.
Date Hour 

-
Instance: Select an instance target for SQL comparison.
-
Lookup criteria: Select the comparison criteria. It generates a chart and then sorts them by rank according to the selected items.
-
excute count: It sorts query results by the number of executions.
-
elapsed max: It sorts searched results by the maximum elapsed time.
-
elapsed time: It sorts searched results by the total elapsed time.
-
elapsed wait: It sorts the searched results by the waiting time.
-
-
View count: Set the count to display in the SQL ranking table list at the bottom of the screen.
Summary Chart
Summary Chart provides a time series graph that allows you to compare SQL trends between the reference date and a comparison date. This allows users to easily check how SQL performance changes over time.

-
◼︎ Blue graph: It indicates the reference date and the number on the right is the average.
-
◼︎ Gray graph: It indicates the comparison date, and the number on the right is the average.
Comparing SQL rankings
The SQL ranking table at the bottom of the screen displays a list of the top SQLs. The displayed number can be set in View count.

The table on the left displays the SQL rankings for the reference date, and the table on the right displays the SQL rankings for the comparison date. You can check the changes in rank compared to the comparison date through the rank changed column in the reference date table.
For example, if a user compares based on the elapsed time and the elapsed time for the same SQL statement on the reference date is greater than the comparison date, the performance of the SQL statement needs to be reviewed. Try using query optimization or indexes to optimize the performance.
Previewing the query

You can check the query of the corresponding SQL statement by hovering the mouse over the query column in the SQL ranking table.
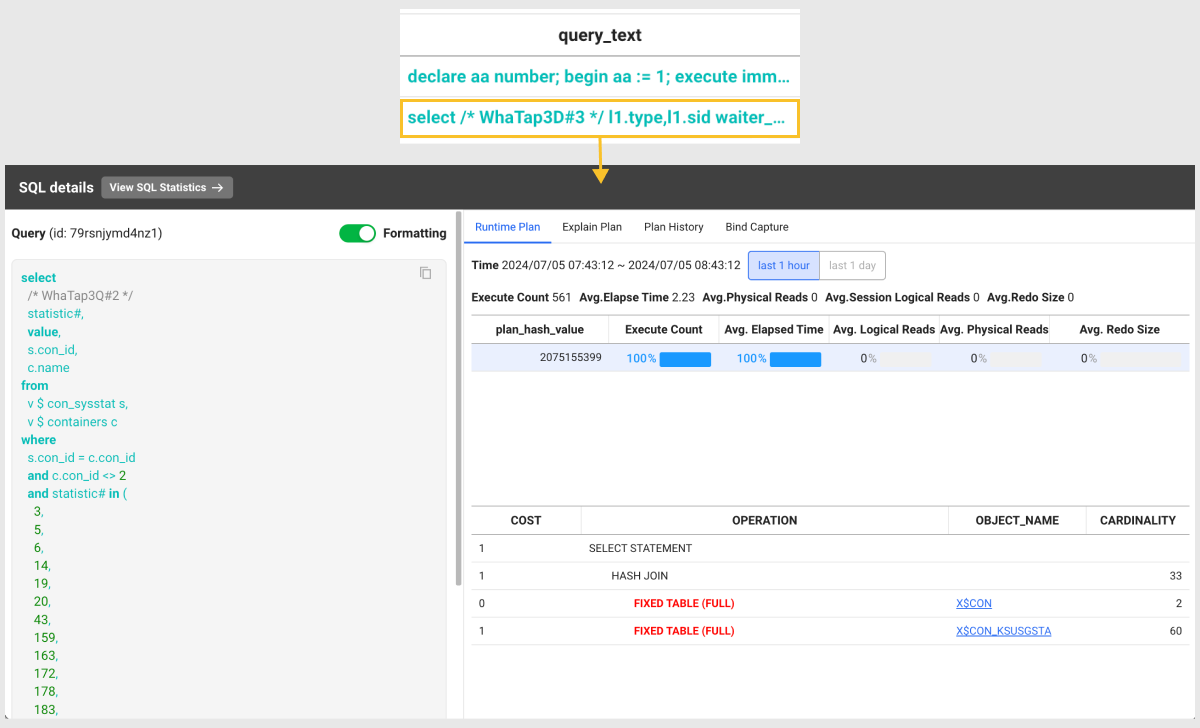
To see the detailed SQL information, select the query column in the SQL ranking table. The SQL details window appears. You can check the SQL query statements and plan information.

- View SQL Statistics: You can go to the SQL statistics menu where you can check statistical information related to the SQL query statement.
-
Runtime Plan: It provides the execution plan and runtime information for a selected SQL query. It provides the information details such as execution count, average execution time, and average physical reads.
-
Explain Plan: It displays the execution plan predicted by the optimizer. It provides information such as cost, job, object name, and cardinality.
-
Plan History: You can check the history of the execution plans of the SQL queries executed in the database.
-
Bind Capture: You can see the values of the bind variables used in SQL queries executed in the database. This allows you to see actual content of query executions.
NoteThis is a value captured in the database (
v$sql_bind_capture), not a bind value executed in real time. If the number of cases is too large, it displays up to 100.