Configuration
This document has been created based on the Oracle Monitoring V2. For the Oracle monitoring V1 document, see the following.
You can take a look at the structure of the WhaTap agent, set additional functions through various options, and monitor the resources of the DB server to be monitored.
Agent structure
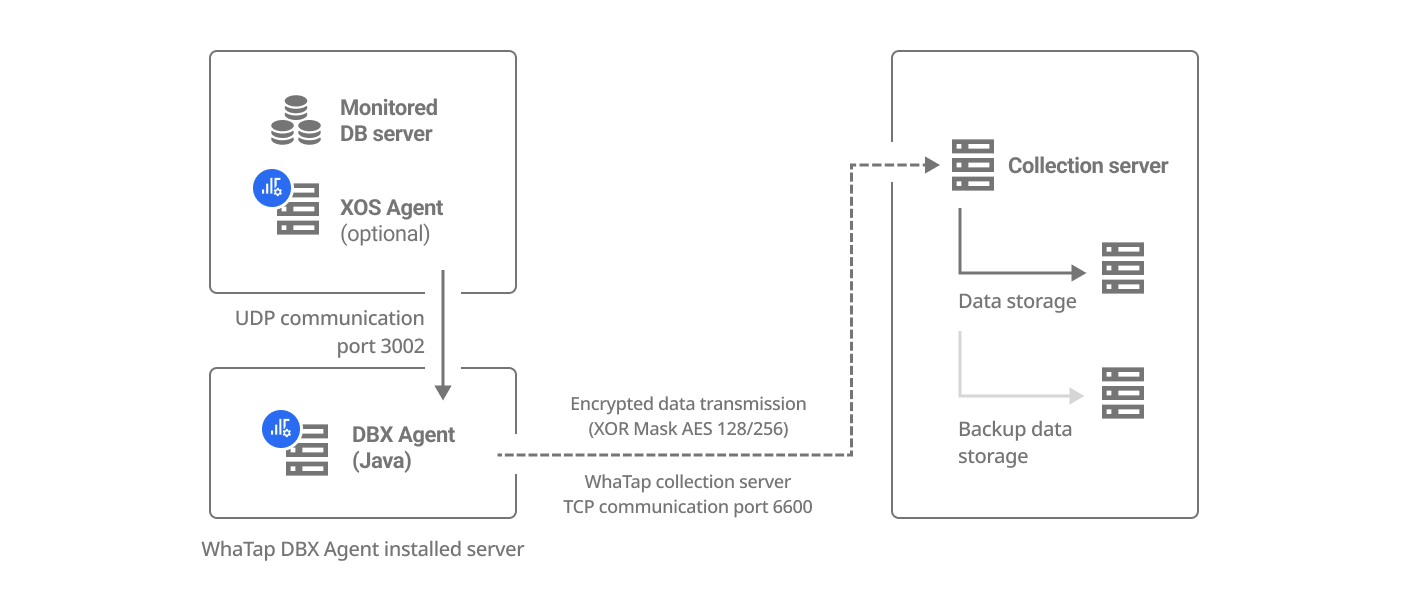
The following displays the WhaTap agent's structure map.

-
Collection server
It collects and stores the database performance data collected by agents, extracts statistical data, and efficiently provides them to users. The collection server can be set by region. Different collection server addresses are allocated to each region. The collection server address may differ depending on the selected region. When creating a project, the region is also set.
-
DBX agent (default agent)
Query-based performance data is collected and transmitted to the server. Monitoring is possible through a separate agent server without installing agents directly on the database server to be monitored.
-
XOS Agent (additional agent)
The additional agent is an optional add-on agent that can monitor the process usage of the database server. To monitor the process usage of the database server, run a separate agent on the database server to collect data.
NoteThe XOS agent can be applied to only the OS environment running on the x86 architecture.
-
Network
-
Default agent: The WhaTap monitoring agent uses the external communication (TCP) port 6600 to transfer the collected monitoring data to the WhaTap collection server.
-
Additional agent: The external communication (UDP) port 3002 is used between the server where the agent has been installed and the database server. If the internal port conflicts, the port can be changed using the
dbx_portoption.
-
Agent CONFIG.
For more information about agent installation, see the following.
DBX Agent Setting
It guides you to the options you can set in the whatap.conf file.
XOS agent configuration
The following explains how to configure the database process monitoring.