Tablespace Size
Home > Select Project > Stat/Report > Tablespace Size
This menu allows you to monitor and manage the usage status of the database tablespace. This menu provides a visual overview of the total size and usage of the tablespace, and allows you to check the detailed usage history.
-
You can visually check the changes in tablespace size and usage over time.
-
It provides the details on the total size, used amount, and used percentage for each tablespace.
- You can check the sizes of the top 50 segments.
By monitoring the usage of tablespaces in real time, you can check the used amount and manage its appropriate capacity. Trace the tablespaces and segments with high usage and then take measures for capacity management and performance optimization. You can also detect and respond to excessive tablespace usage in advance.
Before use
To collect tablespace sizes, you need to set the database roles and agent options. Segment sizes are collected once a day, and the settings must be completed as follows.
DB roles configuration
To collect segment sizes, assign the monitoring users appropriate database roles. Use the following SQL command to set the roles.
grant select any dictionary to monitoring_user;
-- or --
grant select on dba_segments to monitoring_user;
Agent CONFIG.
You can set the criteria for collecting segment sizes through the agent options. The default setting is to collect segments greater than 10 MB every day at 5:00 am.
segments_min_size=10
segments_hour=5
Basic screen guide
-
In Time, set the period to be analyzed.
-
In Instance, select an instance of the database to be analyzed.
-
Select
 .
.
-
The search period can be set up to 3 weeks. If you search for more than 3 days, the graph displays the daily average.
-
For more information on how to use the Time option, see the following.
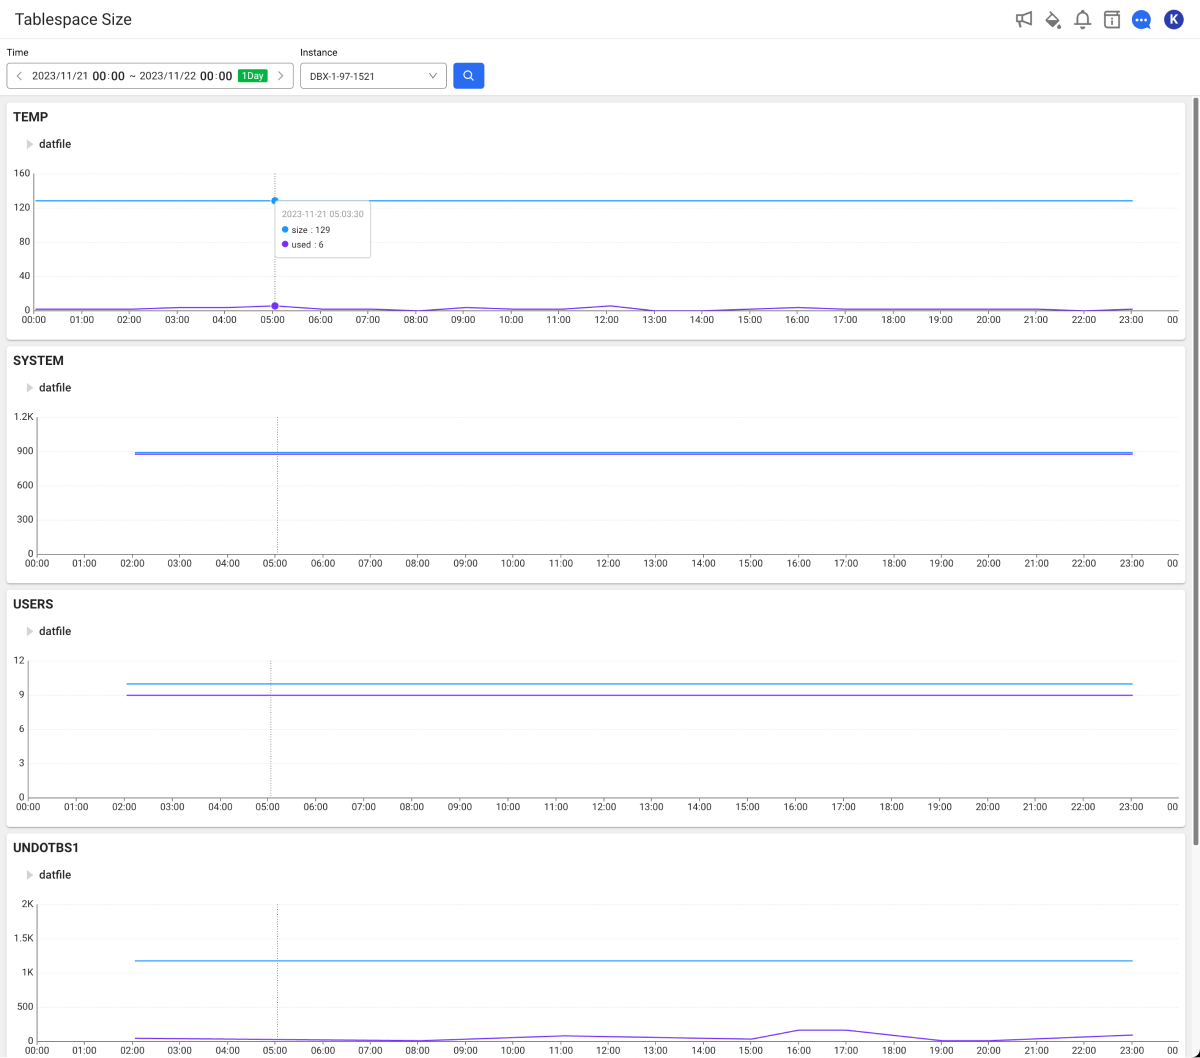
Checking the changes in tablespace size
In the Tablespace size section, you can visually see the overall size and usage of the tablespaces over time.
Each color represents an individual tablespace. To see data for a specific period on the chart, hover your mouse over the chart and move it. A pop-up appears with detailed information for the period.
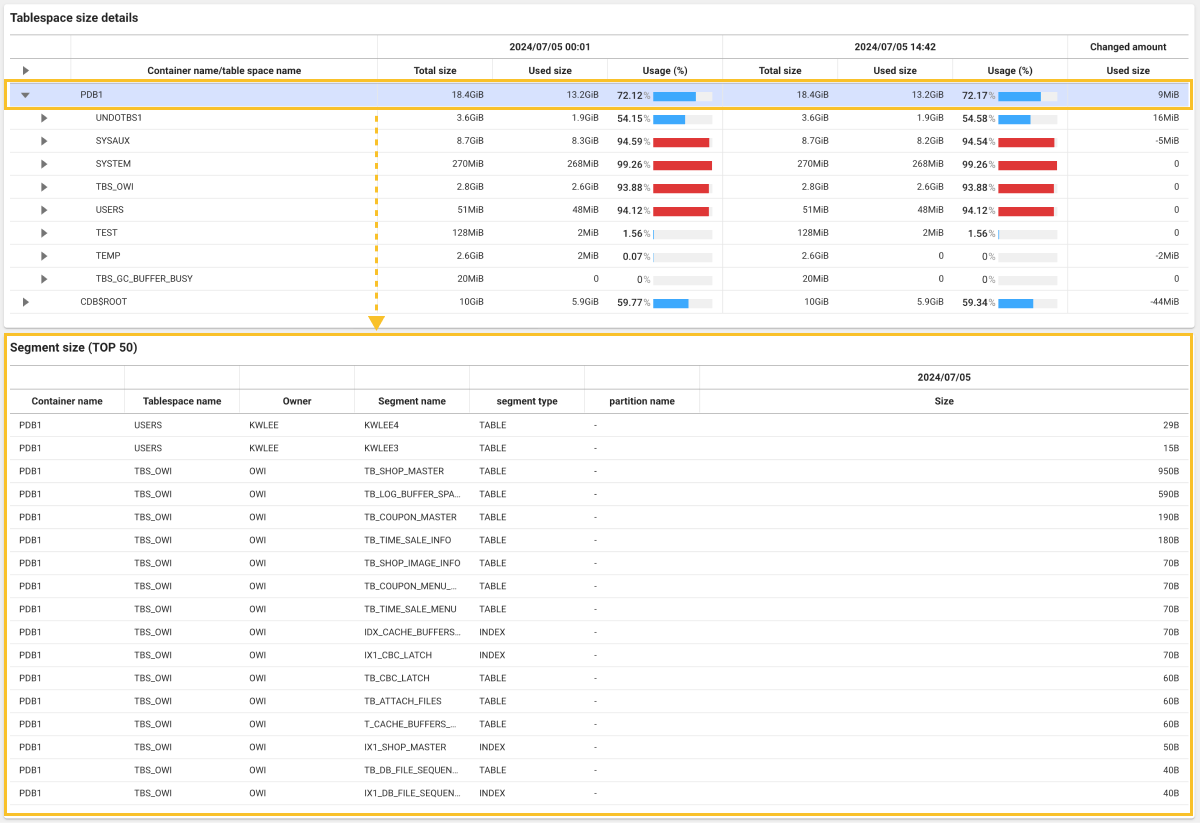
Tablespace size details
The Tablespace size details section provides information details for each tablespace.
Checking the segment size
The Segment size (TOP 50) section provides the detailed usage history by listing top 50 segment sizes.
-
Container name: It is the name of the container to which the segment belongs.
-
Tablespace name: It is the name of the tablespace to which the segment belongs.
-
Owner: It is the user or schema that the segment owns.
-
Segment name: It is the segment name.
-
segment type: It is the segment type (e.g. TABLE, INDEX).
-
partition name: It is the partition name of the segment, if applicable.
-
Size: It is the segment size.