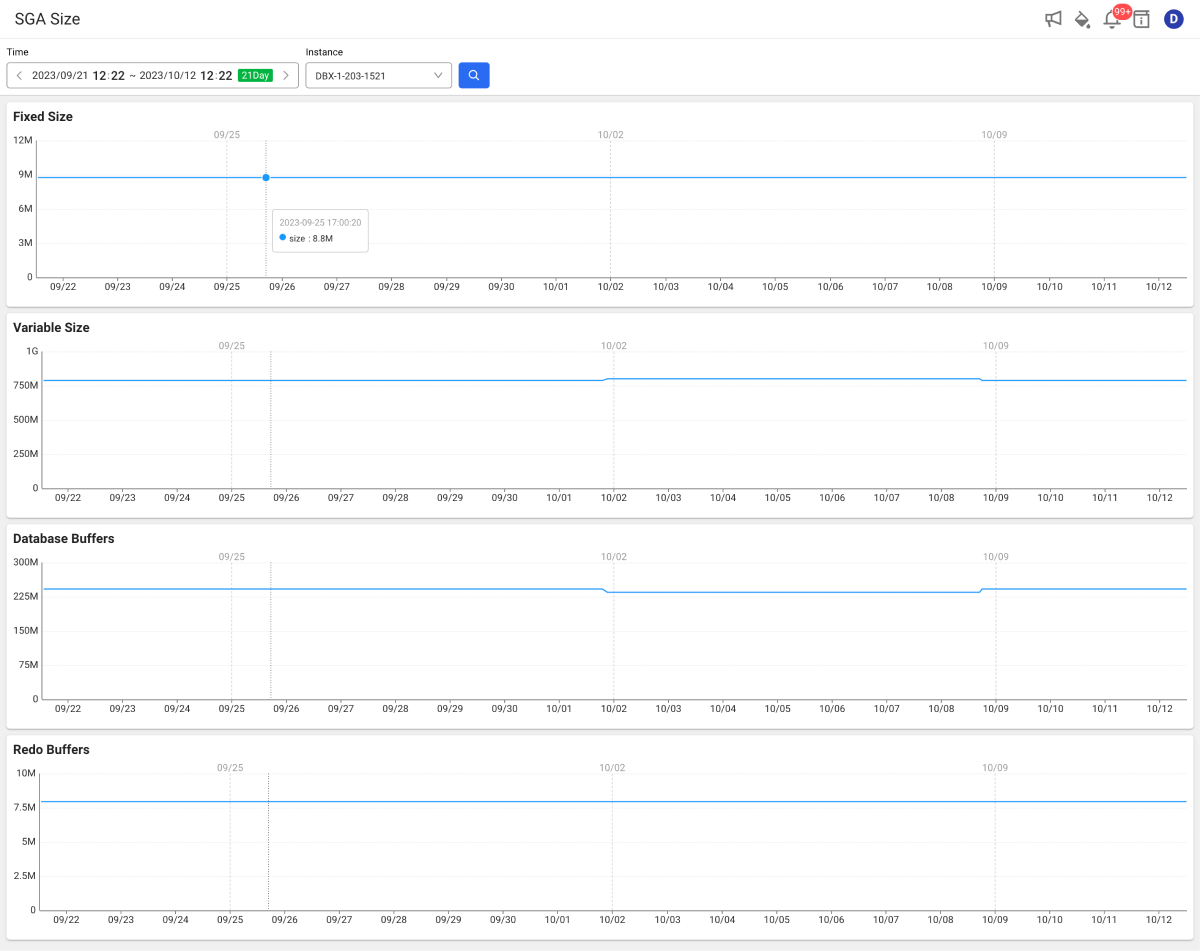
SGA size
Home > Select Project > Stat/Report > SGA Size
You can monitor timely changes by saving summaries of System Global Area (SGA) that is an server memory area.
-
Performance optimization: By monitoring the sizes and usage of various memory areas within the SGA to proactively prevent performance issues and optimally manage memory resources.
-
Bottleneck detection: By early detecting the bottlenecks occurring in each memory area, the availability and stability of the system can be improved.
-
Resource management: You can check whether memory resources are allocated appropriately to reduce unnecessary memory usage and efficiently distribute memory resources.
-
Troubleshooting: By identifying which part of the SGA area are overused so you can quickly troubleshoot the cause of poor performance.
Basic usage guide

-
Set the time to search in Time.
-
Select an instance name to view the trend data of the instance.
-
Select
.
-
The query time can be set up to 3 weeks.
-
For more information on how to use the Time option, see the following.