Monitoring Multiple Instances
Home > Select Project > Dashboard > Multiple Instance Monitoring
In Instance Monitoring, to monitor only one instance, Multiple Instance Monitoring allows you to check and compare metrics and active sessions of multiple instances on one screen. Graph charts make it easy to see how instances' metric values are trending and which instances have higher metric values.
If you select an agent to compare in Dashboard > Instance List, and then select Multi view, the Monitoring Multiple Instances menu appears.
Basic screen guide
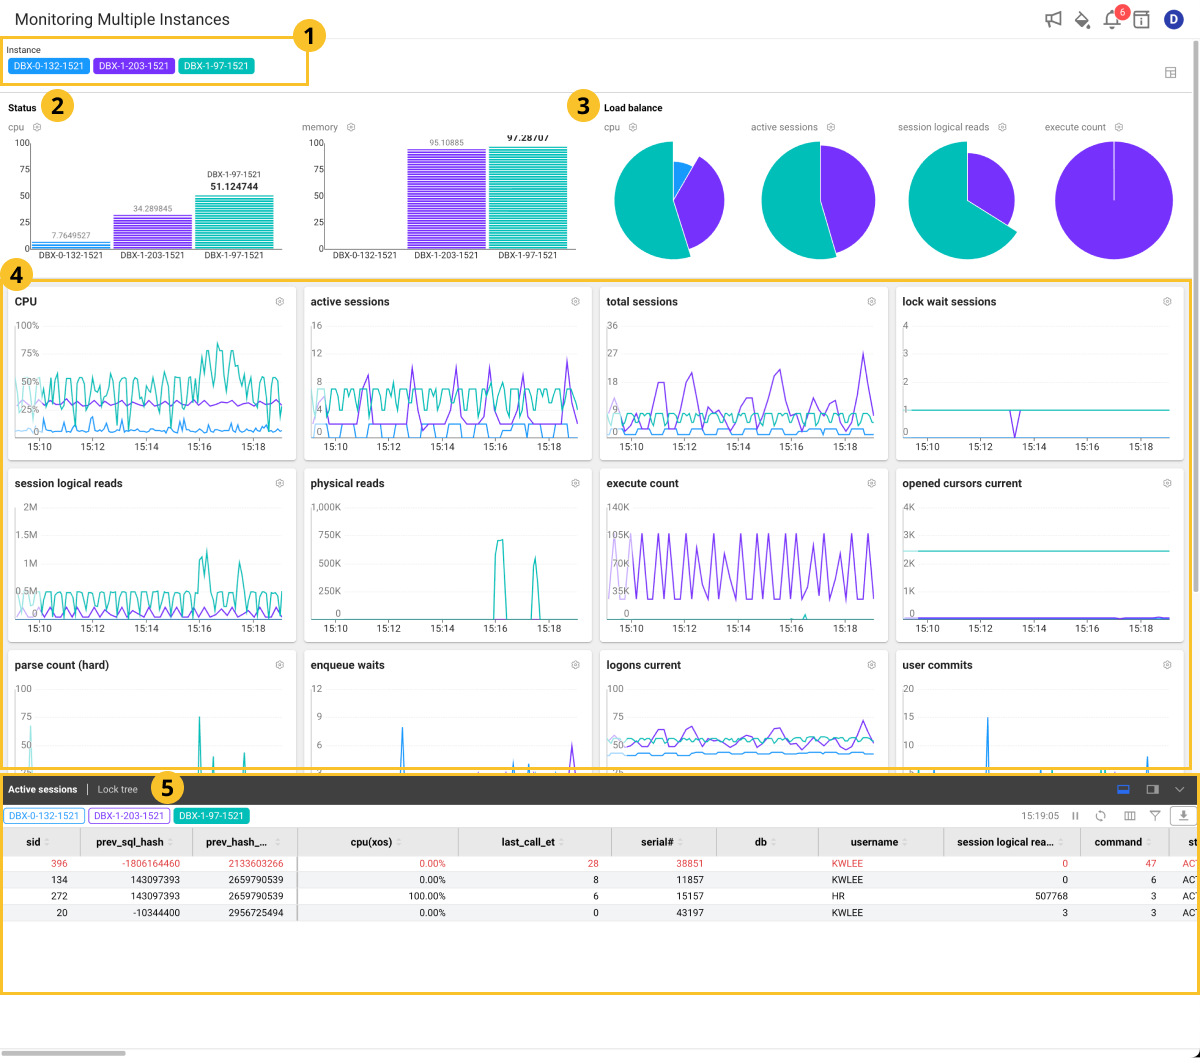
-
Instance
It is a list of instances (databases) where the agent has been installed. The color of the instance matches the color of the graph chart placed on the screen. To exclude some instances of data from the graph chart, select the corresponding instances. If you select the instance again, the graph chart reflects the instance data.
-
Status
You can monitor the metrics related to the resources of your database server.
-
Load balance
You can monitor whether the load is concentrated on one server by checking which instance has a high metric value.
-
Graph chart section
The horizontal axis of each widget is time, and the vertical axis is the metric number.
-
Active sessions | Lock tree | Process Info
You can view the active session, lock tree, and process information for a specific instance. Select Instance Name.
-
For more information about each metric, see the following.
-
For more information about the columns, see the following.
- The Process Info can be viewed by additionally configuring the XOS agent. For more information, see the following.
Selecting a metric
You can change the metric of the graph chart widget placed on the screen to another one.
-
Select
on the upper right of the widget to change the metrics.
-
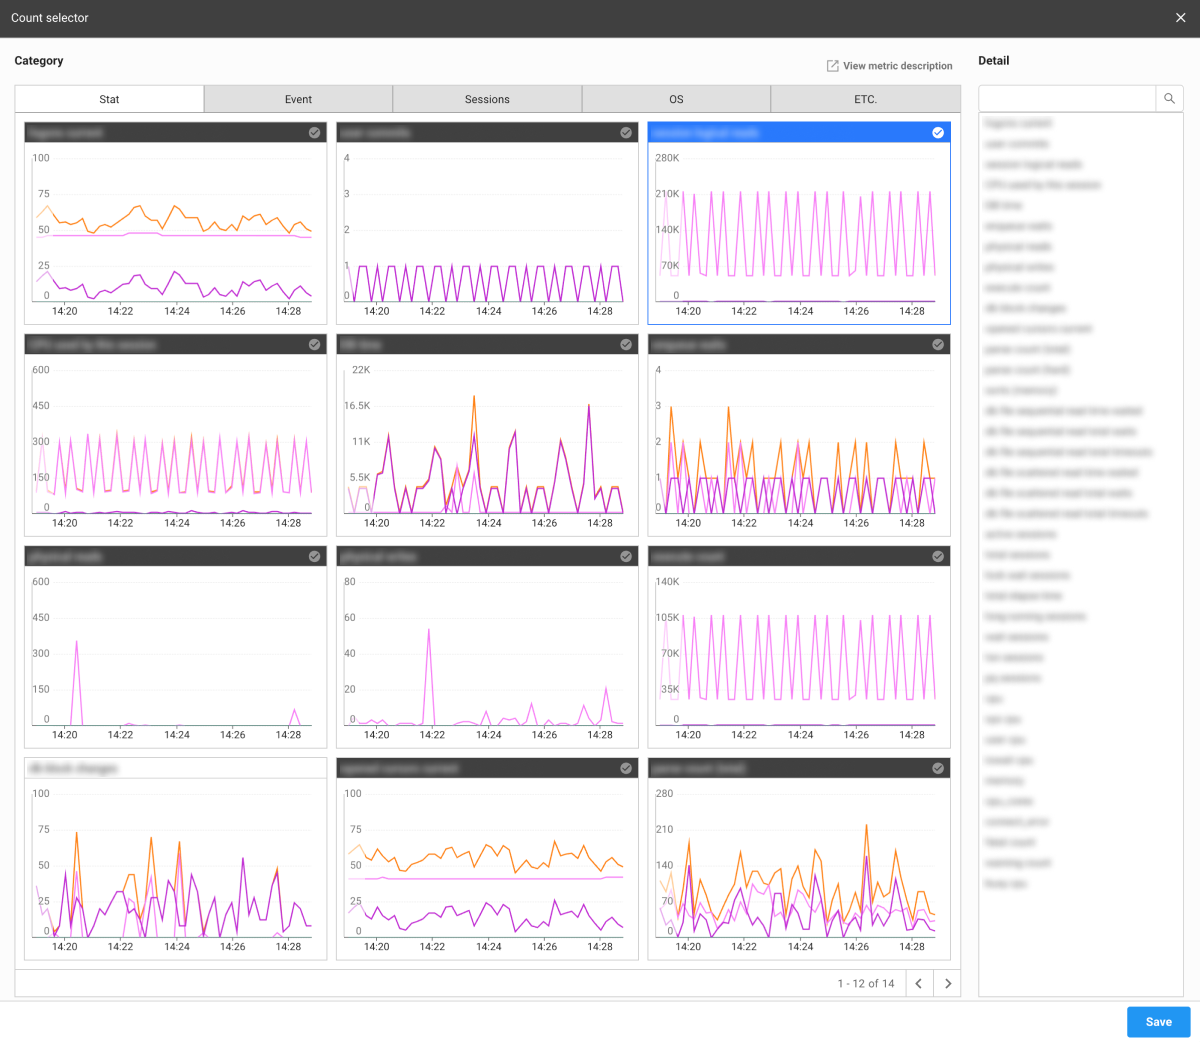
If the Count selector window appears, select a desired metric.
-
Select Save.
The metric of the selected widget is changed.
For more information about each metric, see the following.
Layout setting
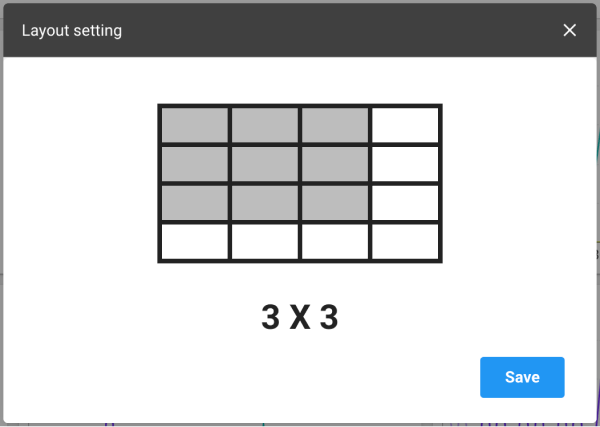
To set the layout on the metrics chart, on the upper right of the screen, select . Nine (3x3) metrics charts are set on the default layout, and you can change the number of charts on a page.
Using the active session section
Through Active sessions at the bottom of the screen, you can see the real-time active sessions. The following provides the guide for the button on the upper right of the table.
: You can stop changing the data collected in real time. To restart it again, select
.
-
: The list of tables is refreshed.
-
: The column header entries in the table can be displayed or hidden.
-
: You can filter the list based on the column header entries in the table. After selecting the button, you can set the conditions in each header column such as Includes, Excludes, Equal, and Unequal.
NoteAdjust the column width if the text field for filter condition options is invisible.
-
: You can download the content of the table as a CSV file.
Stopping an active session
You can stop a session(s) that has been running for a long time.
-
In the Active sessions list, move your mouse cursor to the session to terminate.
-
Select the
that appears on the utmost right.
-
If the Session kill window appears, enter the password.
-
Select Apply.
The session is stopped.
-
Through the paramkey.txt file in the DBX agent installation path, you can find the password.
-
This feature is only available to the members with Edit role. For more information about member roles, see the following.
Zooming in the graph chart section
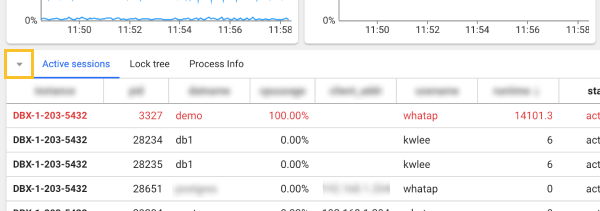
If the current screen is small and difficult to see the widget, you can check the graph chart widget in a wider screen. Select in the Active sessions section at the bottom of the screen. The Active sessions section is collapsed and the graph chart widget section is enlarged.
To zoom out the graph chart widget, select at the bottom of the Active sessions section.
See query details
To check the SQL query information of the executing session, select the query (or sql_text) column in the Active sessions section. The SQL details window appears. You can check the SQL query statements and plan information.
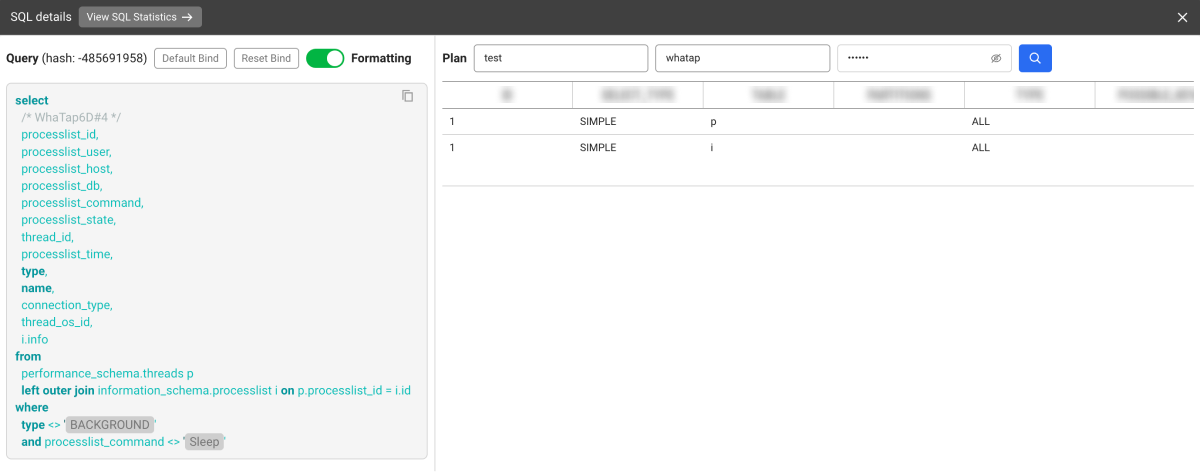
- View SQL Statistics: You can go to the SQL statistics menu where you can check statistical information related to the SQL query statement.
Changing the table columns
You can display or hide the column entries in the table, and change their order.
-
Select
on the upper right of the table.
-
When the Column Setting window appears, hide, add, or change the order of items to be displayed in the table columns.
- Select a column, and then
,
,
or
. Go to Visible or Invisible.
- You can move the position by dragging the column while it is selected.
- Select a column, and then
-
After all settings are finished, select Save.
The setting is saved as a browser cookie value to maintain the state even after refreshing the page. If an error occurs between settings due to cookie deletion or other reasons, it is initialized.
Column information guide
For more information about columns, see the link.
| Item | Description |
|---|---|
sid | Session ID |
cpu(xos) | CPU utilization collected by the installed XOS |
serial# | Value to increment to determine if the same session ID has been used. |
username | DB user name. |
command | Same as COMMAND_TYPE; SQL command number |
status | Session status |
schemaname | Schema. Same as the username. |
osuser | Username of the OS that accessed the session. |
spid | OS process ID. |
process | ID of the client process that accessed the session. |
logon_time | Session created time point. |
last_call_et | If the session is active, it is the elapsed time (sec) since activation. |
sql_text | query, running statement, SQL statement that separates literal strings |
sql_param | Literal value separated from query |
prev_sql_text | Previously executed query |
prev_sql_param | Previously executed query param |
program | Program information executed by client |
type | session type - can be adjusted in user background recursive (whatap.conf). |
seq# | Number that uniquely identifies the current or last wait (incremented with each wait) |
event | Number of the resource or event if the session is waiting. |
p1 | First waiting event parameter (decimal point) |
p2 | Second waiting event parameter (decimal point) |
p3 | Third waiting event parameter (decimal point) |
wait_class | Class name of the waiting event |
wait_time | The value is 0 if the session is waiting. It is the last waiting time (milliseconds) if the value is greater than 0. |
seconds_in_wait | Time spent waiting for the wait if the session is waiting. Otherwise, it is the time elapsed since the last waiting. |
state | Waiting state: WAITING, WAITED UNKNOWN TIME, WAITED SHORT TIME, WAITED KNOWN TIME |
machine | Name of the client server that accessed the session (hostname) |
port | Clinet port number |
terminal | Client terminal name |
module | Name of the module set by the user of the program executed on the client. |
action | Action name set by the user of the running module. |
client_info | Client information set by user |
client_identifier | Client ID set by user |
| session logical reads | Number of times data was read into the buffer cache |
| physical reads | Number of data reads from the physical disk |
| execute count | SQL execution count |
| parse count (hard) | Total number of syntax analysis calls (actual syntax analysis) |
| parse count (total) | Total number of syntax analysis calls (hard, soft, describe) |
| opened cursors current | Number of open cursors |
| db block changes | Change count of all blocks in the database |
| session pga memory | Session's current PGA size |
undo_segid | Undo information ID |
undo_blk | Undo block count |
undo_rec | Undo record count |
sql_address | SQL statement identification data |
sql_hash_value | SQL statement identification data |
sql_id | SQL ID of the running SQL statement |
sql_child_number | Sub number of the running SQL statement |
sql_exec_start | Start time point of SQL running in the session |
sql_exec_id | SQL running ID |
prev_sql_addr | Information that identifies the last run SQL statement |
prev_child_number | Sub number of the last SQL statement executed |
prev_exec_start | Start time point of the last SQL statement executed |
prev_exec_id | Start ID of the last SQL statement executed |
plsql_entry_object_id | Object ID of the top PL/SQL subprogram on the stack. |
plsql_entry_subprogram_id | ID of the top PL/SQL subprogram on the stack. |
plsql_object_id | Subprogram ID of the running PL/SQL object |
taddr | Transaction address |
lockwait | lock wait address (lock address where the session is waiting) |
row_wait_obj | Object ID of the table containing the row specified in ROW_WAIT_ROW# |
row_wait_file | ID of the data file containing the row specified in ROW_WAIT_ROW# |
row_wait_block | ID of the block containing the row specified in ROW_WAIT_ROW# |
row_wait_row | Currently locked row |
pdml_status | If the value is ENABLED, the session is in PARALLEL DML activation mode. If the value is DISABLED, the session does not support the PARALLEL DML activation mode. If the value is DISABLED, the session does not support the PARALLEL DML activation mode. |
pq_status | If the value is ENABLED, the session is in PARALLEL QUERY activation mode. If the value is DISABLE, the session does not support the PARALLEL QUERY activation mode. If the value is FORCED, it indicates the session was changed to force the use of PARALLEL QUERY. |
blocking_session_status | It provides details about whether there is a blocking session. |
blocking_instance | Instance ID for the blocking session |
blocking_session | Session ID for the blocking session |
final_blocking_session_status | It provides details about whether there is a last block session. |
final_blocking_instance | Instance ID for the last blocking session |
final_blocking_session | Session ID for the last blocking session |
service_name | Service name of the session. It is similar to the DB name. |
saddr | Session address |
con_id | ID of the container associated with the data (only for multi-database support) |
rss(xos) | OS metrics collected by the XOS agent |
pss(xos) | OS metrics collected by the XOS agent |
ioread(xos) | OS metrics collected by the XOS agent |
iowrite(xos) | OS metrics collected by the XOS agent |
WhaTap basically stores the client-related information.