SQL Statistics
Home > Select Project > Stat/Report > SQL Statistics
Statistics are created based on the SQL execution count, execution time, and waiting time within the active sessions collected by the agent, and a list of top SQLs for the search period is provided. It provides a basis for analyzing frequently performed SQL performance through the average and maximum execution time.
For quick performance analysis, you can search top SQLs for each frequently analyzed category (DB, USERNAME, MACHINE, PROGRAM). The main search criteria are as follows:
-
execute count: Execution count of the SQL
-
elapse sum (sec): Total execution time (secs) of the SQL
-
elapse avg (sec): Average SQL execution time (sec), which is the result of elapse sum / execute count
-
elapse max (sec): Maximum execution time (sec) of the SQL
- elapse wait (sec): Total waiting time (sec) of the SQL
- instance: Instance name
-
physical reads: Number of times the SQL reads data from the disk
-
session logical reads: Number of times the SQL reads data from memory
-
cpu time: CPU time used while the SQL is running
-
redo size: Size of the transaction log (redo log) generated by the SQL
SQL Statistics function creates statistics based on the SQL that excludes literal values.
Basic screen guide
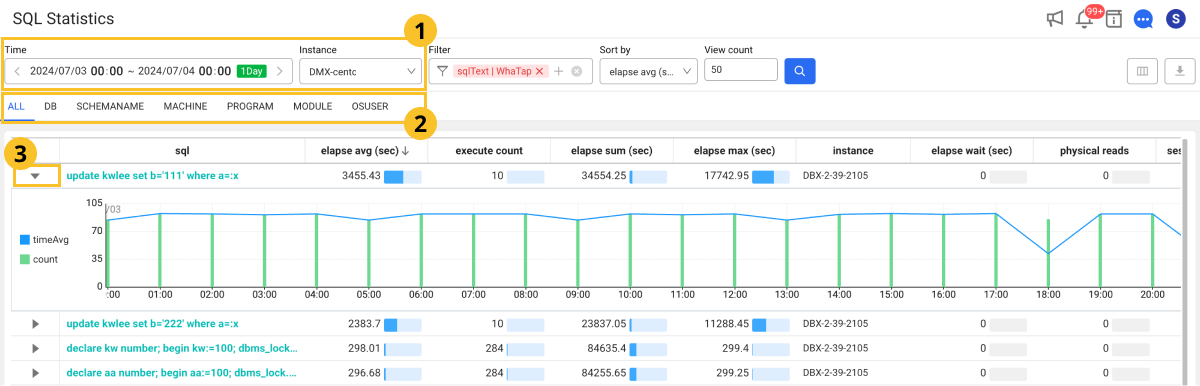
-
In
 Time, select the time and date to view the data. You can select a lookup time after selecting the green button.
 -
In
Instance, select a target to view the data. -
Select
 .
.
The top 50 entries appear in the table.
-
Select the clock display area to query a random date and time. If you click the date and time text area, the selectable options for the date and time appear.
-
If you select each column in the table header, you can sort the list by the selected item.
-
You can sort the searched results by the item selected in Sort by. Select a desired item and then select
 .
. -
In View count, you can set the number of entries to display in the table. Finish the settings and then select
. -
To download the viewed data as a CSV file, select
 .
.
- You can hide the table header columns or add any desired items. You can also change the order of the columns. For more information.
Checking the query-based execution trend
You can classify and search the desired data by usage type or change the sorting order. Select the desired tab from  .
.
On the utmost left for each item of the table, select  ►. A chart appears that displays the number of executions every 5 minutes and the average execution time of the query statement. If you hover your mouse over each bar graph, you can see the number of that time.
| Sorting criteria | Description |
|---|---|
| elapse avg (sec) | Sort by the longest average execution time |
| execute count | Sort by the greatest number of executions |
| elapse sum (sec) | Sort by the longest total execution time |
| elapse max (sec) | Sort by the longest maximum execution time |
| elapse wait | Sort by the longest waiting time for queries |
| physical read | Sort by the greatest number of data blocks read from disk |
| session logical reads | Sort by the greatest number of data blocks read from memory |
Previewing the query
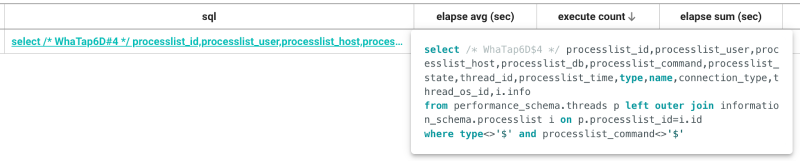
You can preview the query statement by moving the mouse pointer to the sql column in the search results list.
If the sql column is selected from the table list, the SQL details window appears.
Filtering the searched results
Adding the filter conditions
You can filter the results by SQL text, agent name, or DB user name.
-
In the Filter option, click
 .
. -
In Filter key, select a desired filtering criteria.
-
If the value of the selected item is text, you can select any of Includes (blue) and Excludes (red).

-
If the value of the selected item is number, you can select any condition of
==(equal to),>=(greater than or equal to), and<=(less than or equal to).
-
-
In Condition, select a condition.
-
Enter a string or number to match the condition.
-
Select Apply.
Adding and Deleting Filter Conditions
-
To add a filtering condition, click the Add button and repeat steps 1 ~ 5. Added conditions are applied using the AND (
&&) operator. -
To delete specific conditions while adding, click the
 button on the right side of the filter condition. To delete all conditions, click the Delete All button.
 -
To quickly remove all applied conditions from the Filter option, click the
 button.
-
The default setting is to exclude if
sqlTextcontains 'WhaTap'.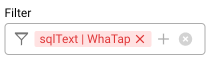
Modifying the filter conditions
-
Click the applied item in the Filter option at the top of the screen.
-
In the Edit filter window, edit the desired item and click the Apply button.